Tutorial
The science behind oRNAment
Protein-RNA interactions execute important roles in several biological functions, including RNA replication, repair, splicing, polyadenylation, capping, modification, export, localization, stability and degradation. Recent in vitro technologies, such as RNAcompete [1] and RNA Bind-n-Seq (RBNS) [2], have provided exquisite resources for identifying the binding preferences of RBPs.
We acquired all motifs from RNAcompete in the form a position weight matrix (PWM) and executed the RBNS algorithm on the sequencing data made available by ENCODE. As most motifs determined by RNAcompete were of length 7, we concentrated on those and set the output motif PWM length of RBNS to also be 7. Therefore, all motifs in the database are of length 7 nucleotides and are comparable (see motifs tab).
We developed a novel algorithm that allows us to scan for these motifs with yet unachieved efficiency (see algorithm tab). We then executed it for each RBP on the complete coding and non-coding transcriptomes of human and 4 main model organisms described by Ensembl (C. elegans, D. rerio, D. melanogaster, M. musculus) in oRNAment v1, and further extended to 10 more model organisms in V2, bringing the total organisms scanned to 15. As there might by interesting evolutionary question answered with the help of this database, we scanned for each RBPs in all transcripts of every organism independently of whether a given RBP is expressed or not. We have shown that our method can accurately predict the putative binding sites observed by eCLIP [3] in humans (See validation tab).
[1] Ray, D., et al. (2013) A compendium of RNA-binding motifs for decoding gene regulation. Nature.
[2] Lambert,N., et al. (2014) RNA Bind-n-Seq: Quantitative Assessment of the Sequence and Structural Binding Specificity of RNA Binding Proteins. Mol Cell, 54, 887.
[3] Nostrand,E., et al. (2016) Robust transcriptome-wide discovery of RNA-binding protein binding sites with enhanced CLIP (eCLIP). Nat Methods, 13.
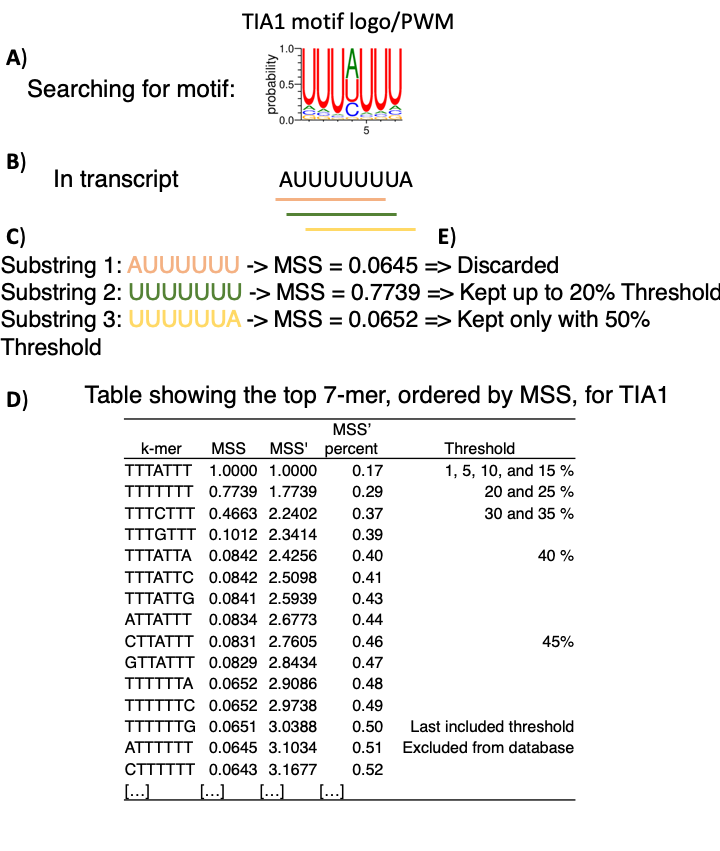
The search algorithm scans each transcript and for each subsequence of length 7, the length of each motif, calculate its matrix similarity score (MSS). The MSS is defined as MSS = current_score – mimimum_score / maximum_score – minimum score. This will provide a value between 0 and 1 where 1 is the canonical motif. The score_current is defined as the product of each probability to observe a given nucleotide at a given position in the PWM. The score_maximum is the product of each maximum probability value in the PWM at each position. The score_minimum is the product of each minimum probability value in the PWM at each position.
Independently, the sum of all MSS score for each 4^7 possible substrings (k-mer) was calculated. A score, MSS’, is calculated by sequentially adding the MSS value of each k-mer incrementally. A score MSS’ % is obtained by dividing, for each k-mer, its MSS’ by the sum of all MSS’. A threshold can thus be calculated by taking the MSS scores representing up to 50% of all possible scores, by steps of 5%.
As shown in the figure, when searching for a given RBP motif (A) in a specific transcript (B), we can rapidly scan for each k-mer (C) and directly look it up in a table (D) in constant time, through the use of a dictionary, and populate the database with substrings passing the threshold as putative motif instances (E).
The database has been substantially expanded to now include a total of approximately 3.8 billion target site predictions for 2,089 distinct RBPs represented by 492 experimentally derived motifs in human and 14 diverse organisms. The overwhelming majority of RBPs in oRNAment are conventional RBPs containing canonical RNA binding domains and involved in major regulatory processes governing the RNA life cycle. [1]
In oRNAment V2 we decided to treat homologs from different species as different RBPs due to the increased number of species and predicted RBPs. In addition, we clustered these RBPs based on the similarity of their motifs. In general, all RBPs that share at least one motif across all species are clustered together. We further inspect the clustering to ensure that it is meaningful and name each cluster according to its most representative RBPs.
Please visit the motif page for more descriptions of motifs, motif clusters, their associated RBPs in each speci
The logos and their Position Weight Matrix can be downloaded in the download page.
All RNAcompete motifs are from CisBP-RNA [2], retrieved in May 2026, while all RBNS motifs were previously re-processed in oRNAment V1.
[1] Ray, D. et al. (2023) RNA-binding proteins that lack canonical RNA-binding domains are rarely sequence-specific. Sci Rep. 2023 Mar 31;13(1):5238. [2] Rosado-Tristani,D.A., et al. (2026) CisBP-RNA: a web resource for eukaryotic RNA-binding proteins and their motifs. Nucleic Acids Res, 54, D98–D105.
To provide experimental support to putative RBP binding sites, we added a CLIP field to the result tables. We compared oRNAment V2 binding sites with CLIP regions from the POSTAR3 CLIPdb [1,2] module which includes CLIP data for six oRNAment V2 species: C. elegans, D. rerio, D. melanogaster, H. sapiens, M. musculus and S. cerevisiae. Mouse CLIPdb data were provided for the mm10 assembly and were converted to mm39 using liftOver. Chromosome names were also converted to match those used in oRNAment. We used Ensembl BioMart to map CLIPdb and oRNAment RBP names when no exact match was found between the two databases. RBPs with synonym-based matches were manually curated. CLIPdb and oRNAment files were converted to BED format and compared with BEDtools intersect v2.31.0, enforcing strandedness (-s option) and treating each BED block independently (-split option).CLIPdb binding regions were compared with putative RBP binding sites of all motifs in clusters that had at least one RBP match in both databases. For example, human putative RBP binding sites for all motifs in the RBFOX cluster were compared with human CLIPdb regions for RBFOX1 and RBFOX2. Putative RBP binding sites overlapping a CLIP region from the same RBP received a CLIP support score of 2; those overlapping a CLIP region from another RBP in the same cluster received a score of 1; and those with no CLIP overlap or no available CLIP comparison received a score of 0.The data were retrieved in July 2026.
[1] Zhao,W., et al. (2022) POSTAR3: an updated platform for exploring post-transcriptional regulation coordinated by RNA-binding proteins. Nucleic Acids Res, 50, D287–D294.
[2] Yang,Y.-C.T., et al. (2015) CLIPdb: a CLIP-seq database for protein-RNA interactions. BMC Genomics, 16, 51.
To determine the age of motif instanceshits across 6 mammalian species (Homo sapiens, Pan troglodytes, Macaca mulatta, Microcebus murinus, Mus musculus, Rattus norvegicus), we used the Zoonomia consortium alignment of 447 mammalian genomes [1-3], along with the inferred ancestral sequences contained therein. Each ancestral node of the mammalian phylogenetic tree was first dated based on the TimeTree database [4]. For motif hits aligned to genome assemblies differing in version from those in the mammalian alignment, we used UCSC liftover tool and corresponding chain files to map coordinates between assembly versions [5] . We used halliftover [6] to map each motif instance found in a modern species to each of its ancestral sequences (for example, in the case of human, there are 12 ancestral nodes, ranging from the human-chimp ancestor to the ancestor of all eutherians). When a halliftover was found, the corresponding ancestral sequence was extracted, along with an additional 6 nt on either side. The extended ancestral sequence was deemed a hit if contains a motif match with a score at least in the 50th percentile. Finally, we estimated the age of a modern-species motif hit by the age of the most ancient ancestral node containing a hit.
[1] Kuderna, L. F., et al. (2024). Identification of constrained sequence elements across 239 primate genomes. Nature
[2] Zoonomia Consortium (2020). A comparative genomics multitool for scientific discovery and conservation. Nature
[3] Cock, P. J., et al. (2009). Biopython: freely available Python tools for computational molecular biology and bioinformatics. Bioinformatics
[4] Kumar, S., et al. (2022). TimeTree 5: an expanded resource for species divergence times. Molecular biology and evolution.
[5] Casper, J., et al. (2026). The UCSC genome browser database: 2026 update. Nucleic Acids Research
[6] Hickey, G., et al. (2013). HAL: a hierarchical format for storing and analyzing multiple genome alignments. Bioinformatics.
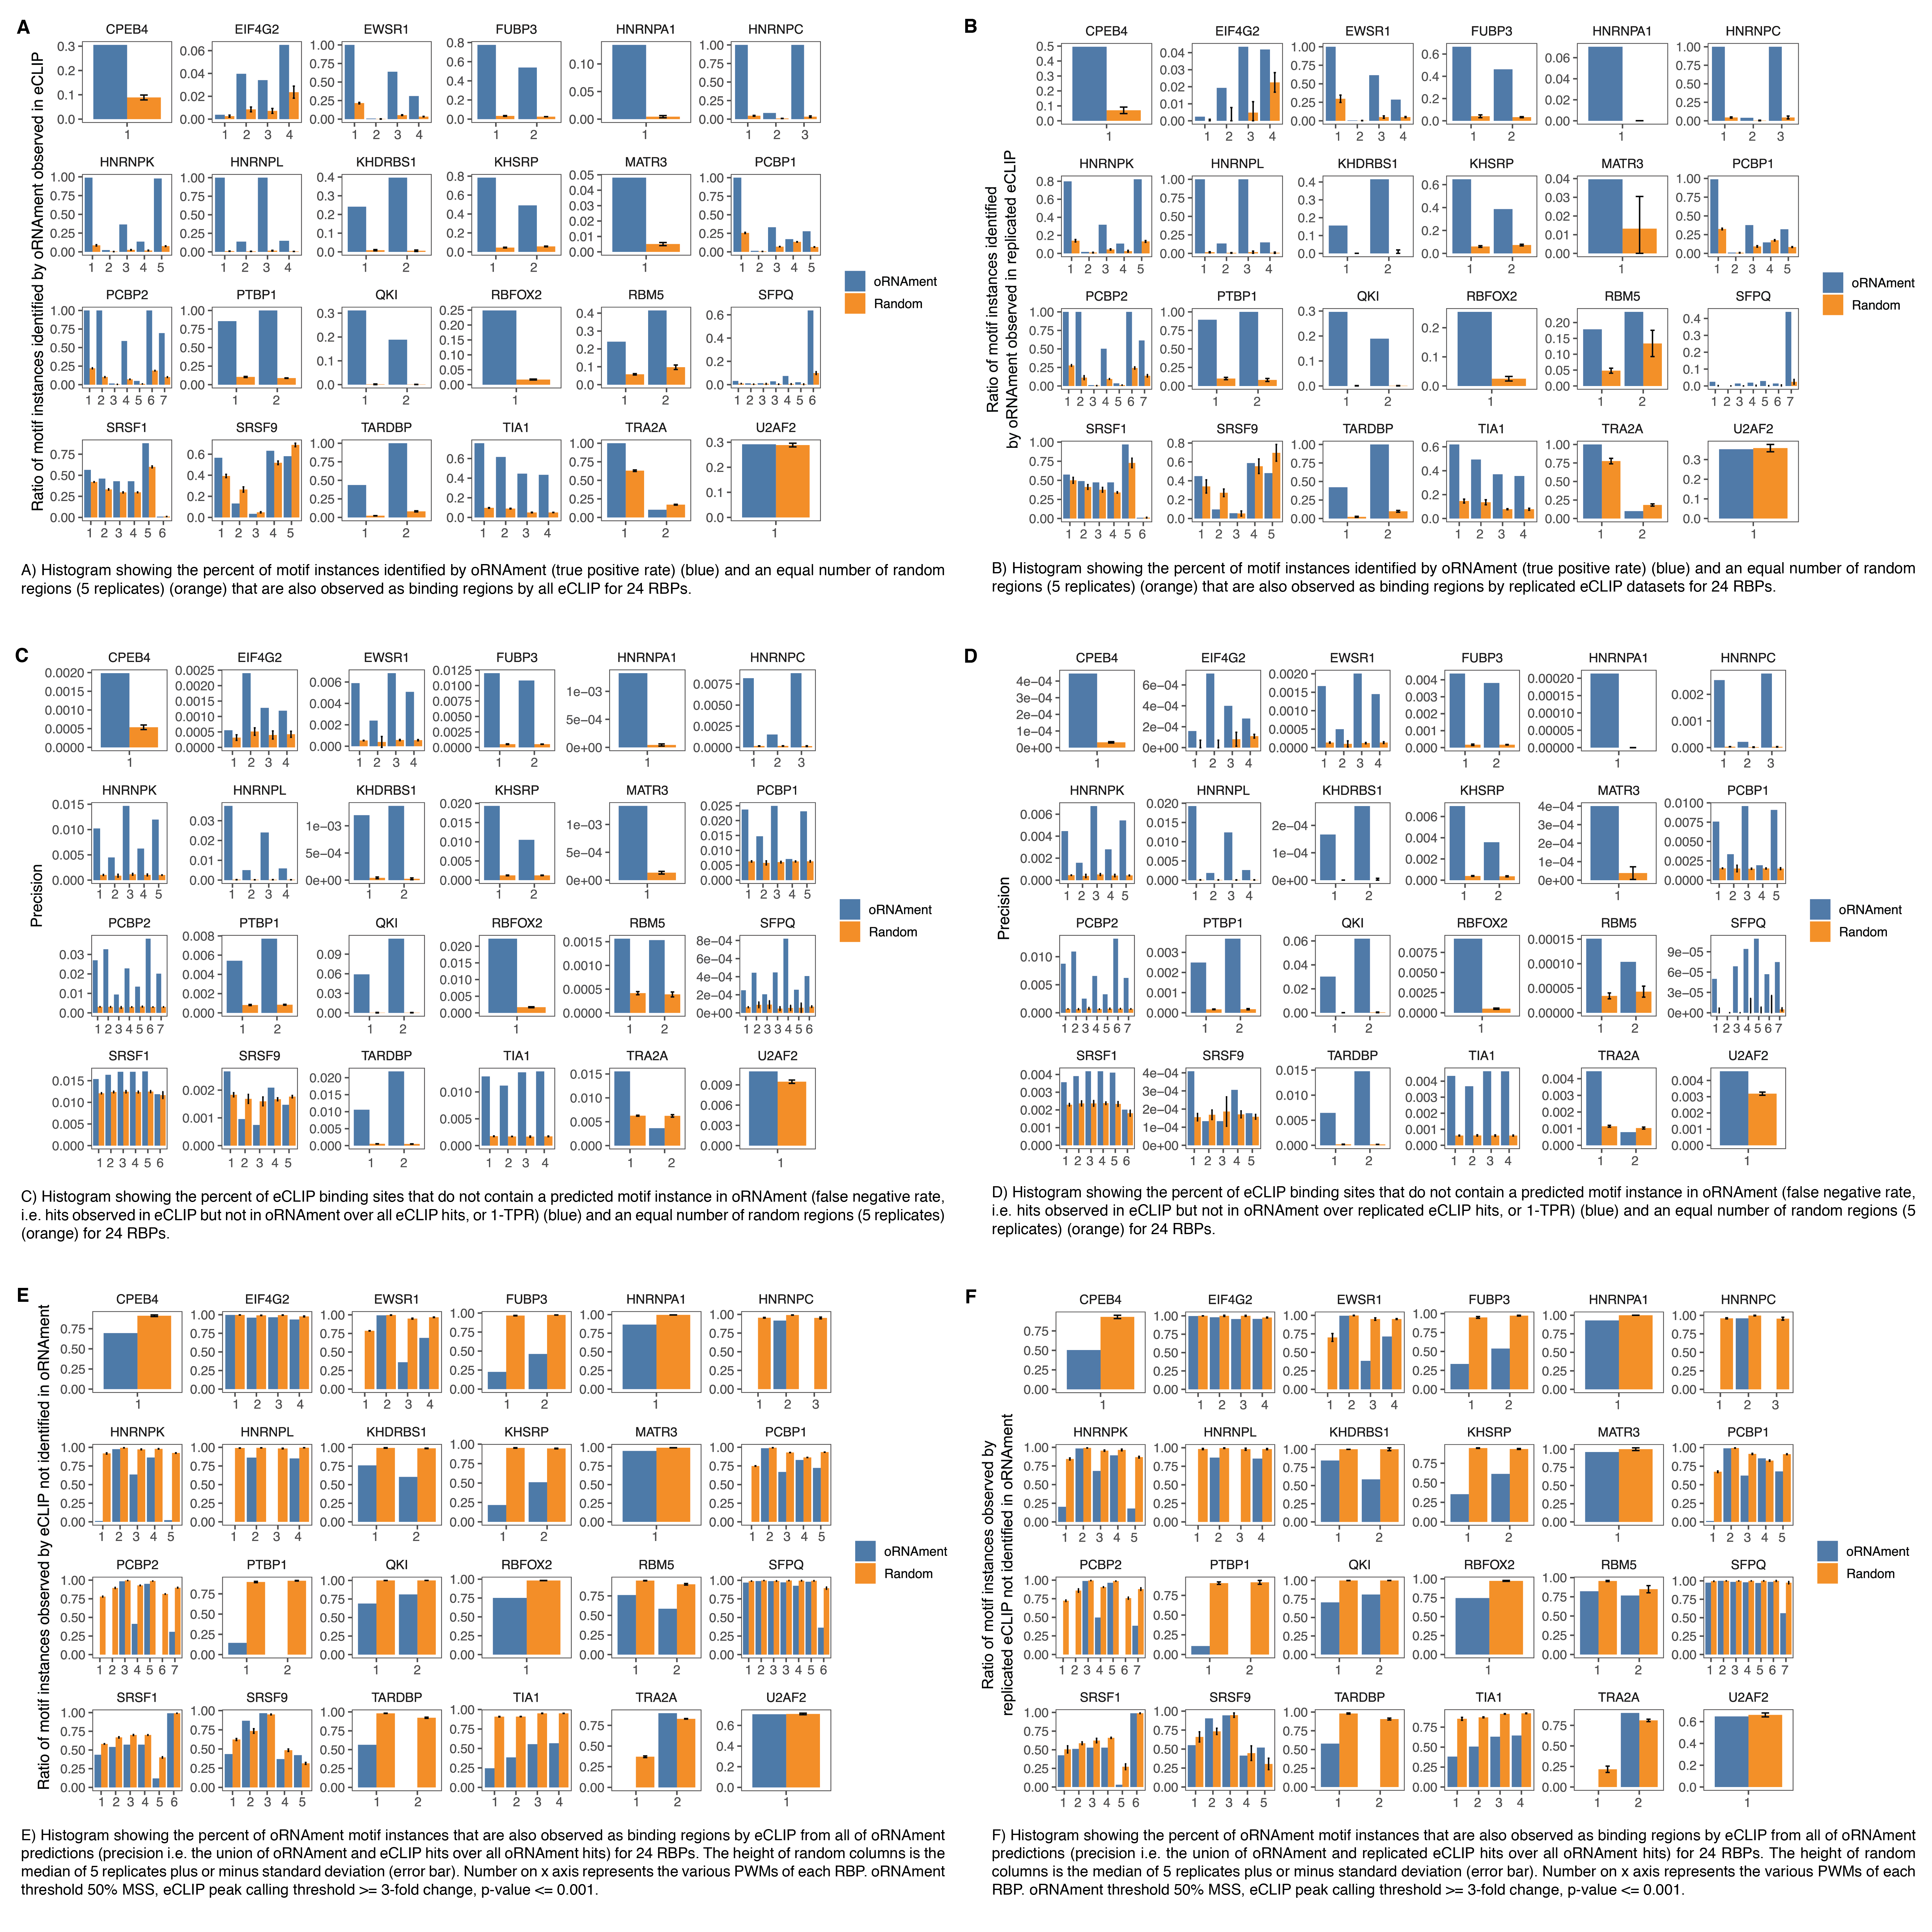
The genomic region of motif instances identified by oRNAment at a threshold of 50% greatly correspond to the binding regions observed by eCLIP at a threshold of 3 fold change and a p-value of 0.001. Furthermore, the same number of random genomic regions as observed by oRNAment are seldom matching a binding region in eCLIP.
In oRNAment V2 we improved our database in the following aspects:
- Motif instances are now predicted using the recent Ensembl release 115 (September 2025).
-
Ten new species have been added, bringing the total to 15 species covered in the database:
- Human (Homo sapiens) Genome Assembly GRCh38
- Mouse (Mus musculus) Genome Assembly GRCm39
- Fruit Fly (Drosophila melanogaster) Genome Assembly BDGP6.54
- Zebrafish (Danio rerio) Genome Assembly GRCz11
- Roundworm (Caenorhabditis elegans) Genome Assembly WBcel235
- Chimpanzee (Pan troglodytes) Genome Assembly Pan_tro_3.0
- Rhesus macaque (Macaca mulatta) Genome Assembly Mmul_10
- Olive baboon (Papio anubis) Genome Assembly Panubis1.0
- Gray mouse lemur (Microcebus murinus) Genome Assembly Mmur_3.0
- Rat (Rattus norvegicus) Genome Assembly GRCr8
- Chicken (Gallus gallus) Genome Assembly bGalGal1.mat.broiler.GRCg7b
- Western clawed frog (/i>Xenopus tropicalis) Genome Assembly UCB_Xtro_10.0
- Budding yeast (Saccharomyces cerevisiae) Genome Assembly R64-1-1
- Lizard (Anolis carolinensis) Genome Assembly AnoCar2.0v2
- Zebra finch (Taeniopygia guttata) Genome Assembly bTaeGut1_v1.p
- Expanded RBP and motif coverage: the database now includes 2,089 RBPs across 15 species and 492 motifs. Homologous RBPs from different species are counted separately, though they typically share the same motif. The complete relationship table between the motifs and the RBPs can be found in the download page
- Extended scan regions to include up to 150 nt of intronic sequence flanking exons, enabling coverage of splicing regulatory signals and other functions dependent on exon–intron boundaries. Intron are tagged through their host transcript, in the format of (transcript id)_(intron number)_(side), where side indicates whether it involves the 5' or 3' of the intron, or 5-3 if the entire intron is shorter than 300 nt.
- Added search function to table views of motif instances to help navigate through all the motif instances identified in our database.
- Added links to UCSC genome browser track hubs to interactively browse motif instances
- Added CLIP support for predicted motif instances
- Added estimated motif age for mammals to show the conservation of motifs
Please cite: Louis Philip Benoit Bouvrette, Samantha Bovaird, Mathieu Blanchette, Eric Lécuyer oRNAment: A database of putative RNA binding protein target sites in the transcriptomes of model species. https://doi.org/10.1093/nar/gkz986 Delong Zhou, Shaimae I. Elhajjajy, Gabrielle Deschamps-Francoeur, Marie Sandler, Maroua Ait El Baz, Mathieu Blanchette, Eric Lécuyer oRNAment V2: an expanded database of putative RNA binding protein target sites in the transcriptomes of diverse model species (In preparation)
The search by... forms
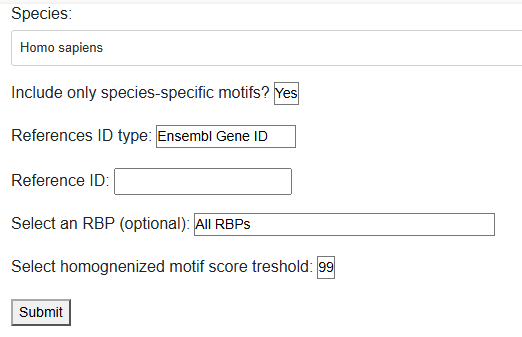
This tool allows you to search the database for a specific gene or transcript, for which you would like to know all putative RBP motif instances (by leaving the RBP choice as "All RBPs"), or for one RBP by choosing it from the drop down list. The choice of RBP also include the species to which it belongs, so the species-specific flag is ignored.
All choice fields are searchable.
In V2 only one gene is allowed at a time to reduce server pressure as by including intron and expanding our RBP list, a lot more motifs are detected than in the previous version.
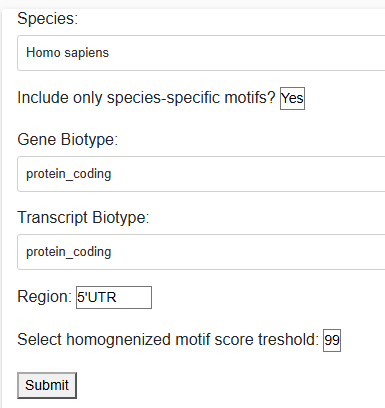
This tool allows you to search the database for a specific combination of attributes in a given species for which you would like to know all putative RBP motif instances.
Select the species and the biotype or region of interest. Notice that not all combinations of choices are compatible.
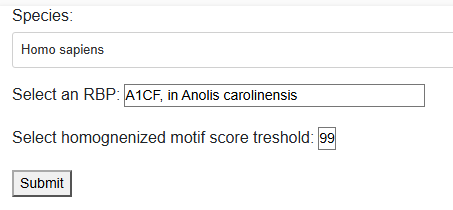
This tool allows you to search the database for a specific RBP from a specific species, at a specific similarity threshold between the PWM and the subsequence, for which you would like to know all its putative instances in all the coding and non-coding transcripts of the selected organism.
Select your organism and your RBP of interest. Input the threshold for motif score, whose range is limited between 0.5 and 1 to limit output table size while allowing for good overlap between motif prediction and in vitro binding essay results.
All choice fields are searchable.
The results pages
The different search tools provide for various top-level graph analysis and a detailed table of all motif instances in each transcript. Kindly note that, by design, the database uses a "transcript-centric" view. Motifs instances coming from different isoform of a gene may have the same genomic coordinates. Therefore, a motif instance can be present more than once in the table, but will always represent two or more distinct transcripts of a gene.
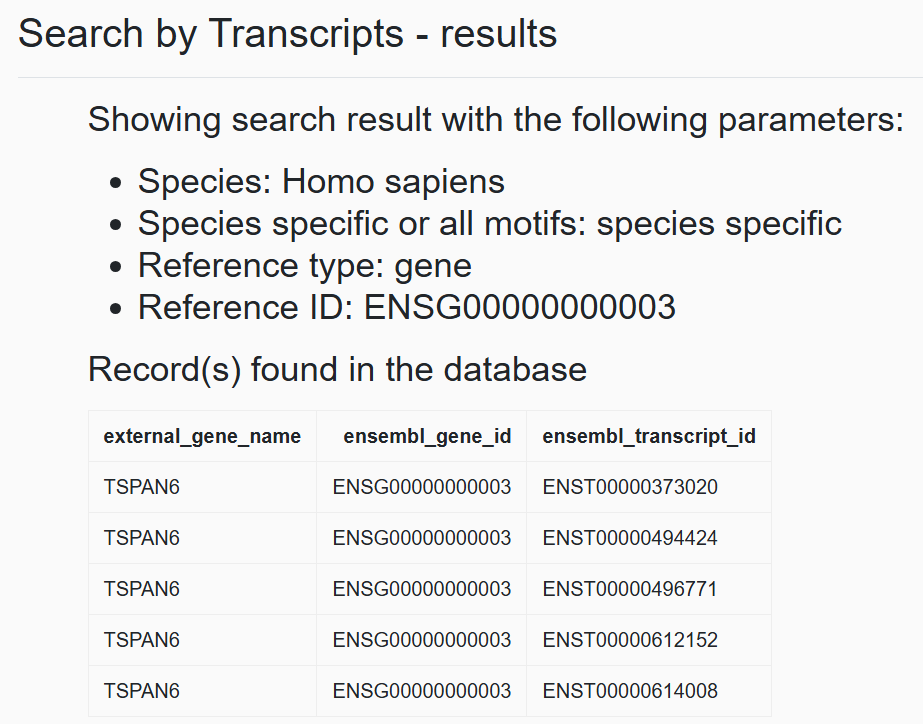
The result page starts always with a call back of search criteria
The following plots and tables are interactive and searchable when a lot of entries are expected.
The data for each plot and entire table of motif instances can be downloaded as file. Please note that the CSV may take a moment to generate.
When searching by gene name it could map to multiple Ensembl Gene ID if they are found on alternative contigs among other reasons. When searching by transcript, while we executed the scan on all transcripts available from the Ensembl database, due to varying nomenclature and versioning, it is possible that a specific gene name/ID will not be found in oRNAment.
Either case a table containing identified gene and transcripts is shown in the result page.
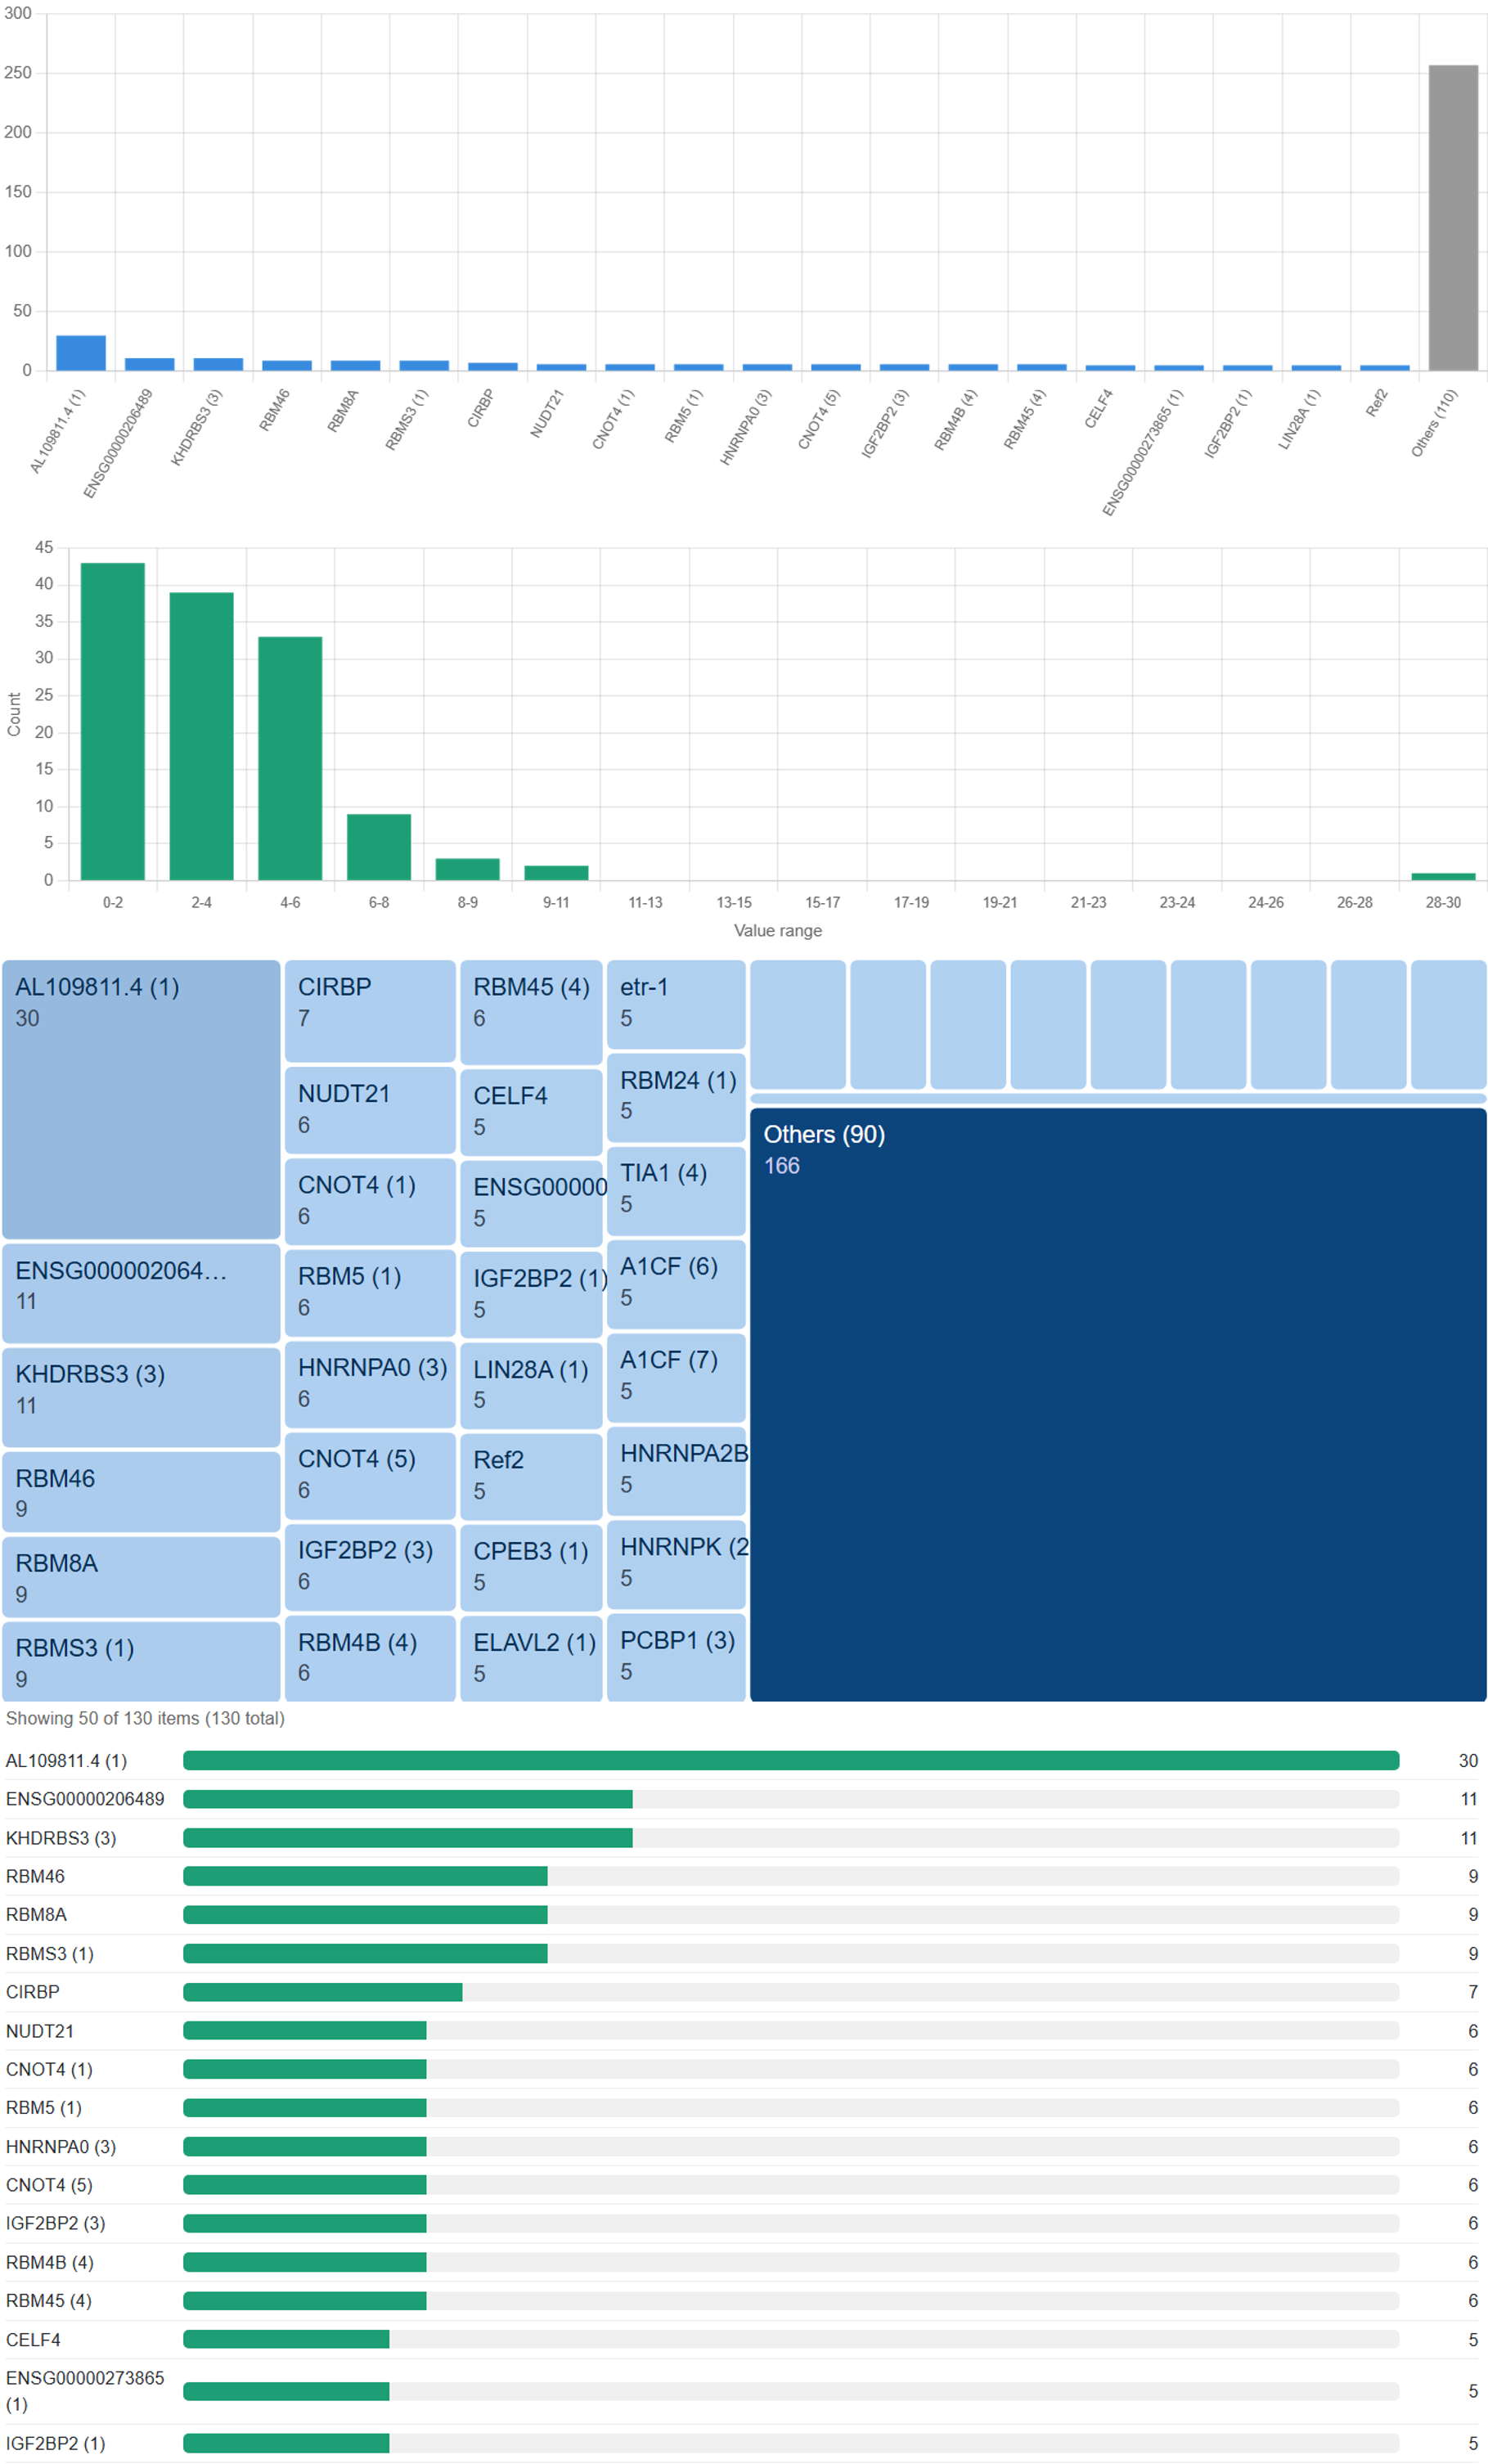
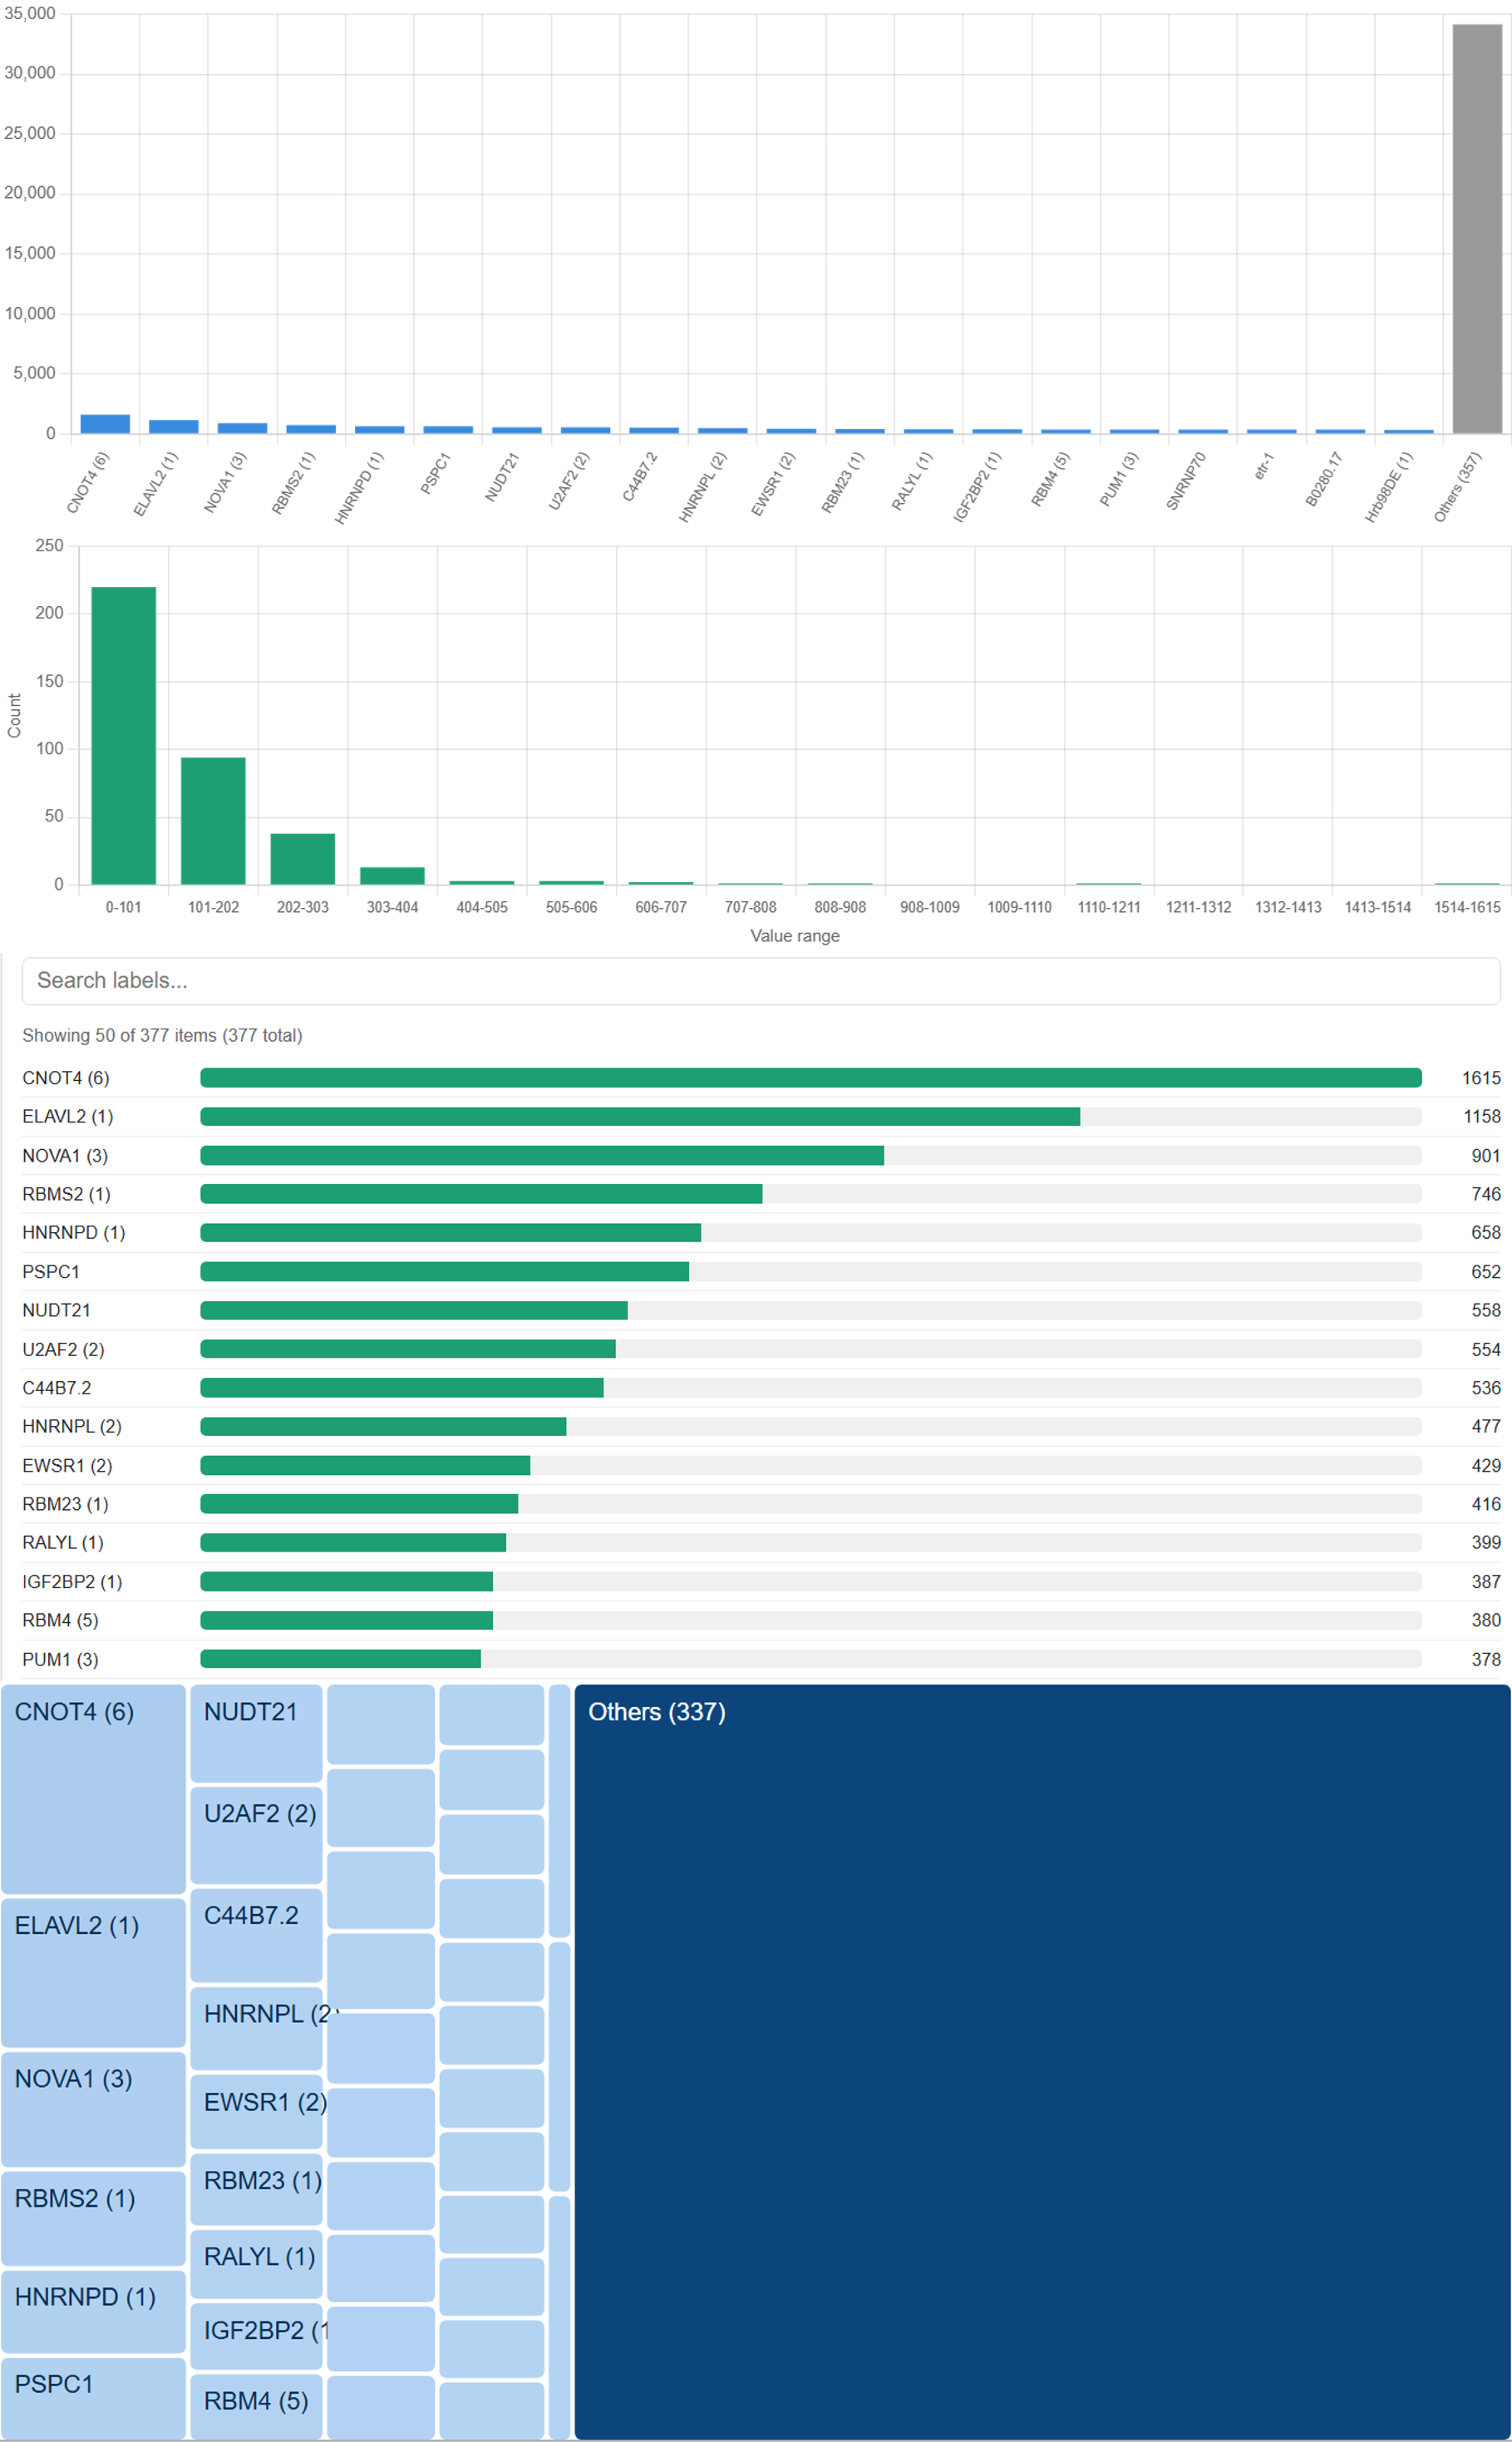
The first plot shows the motif abundance through bar plot, histogram, tree map and searchable table. Different motifs of the same RBP are displayed individually.
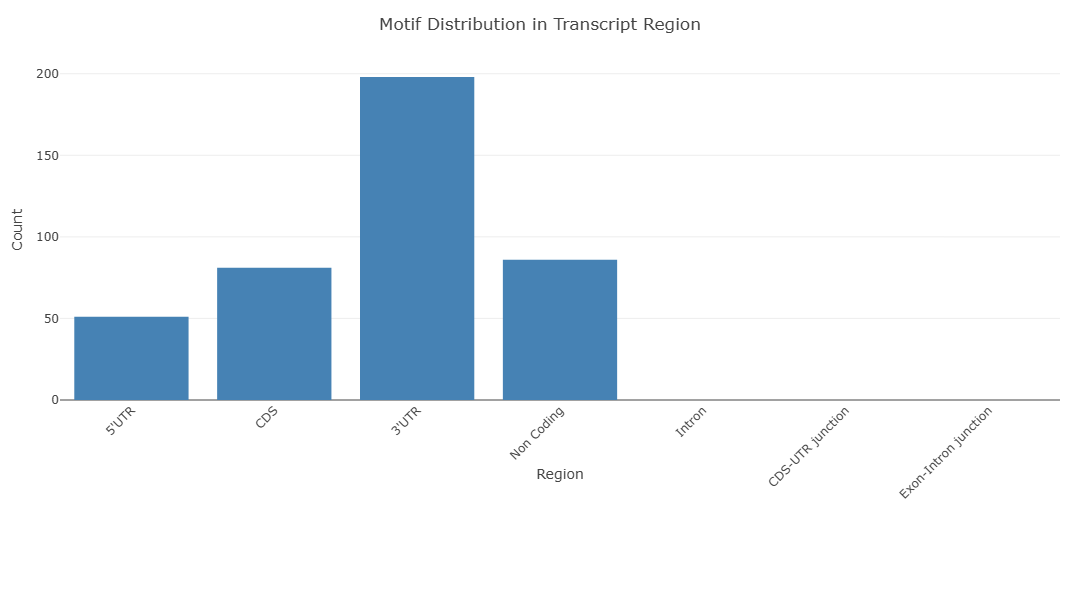
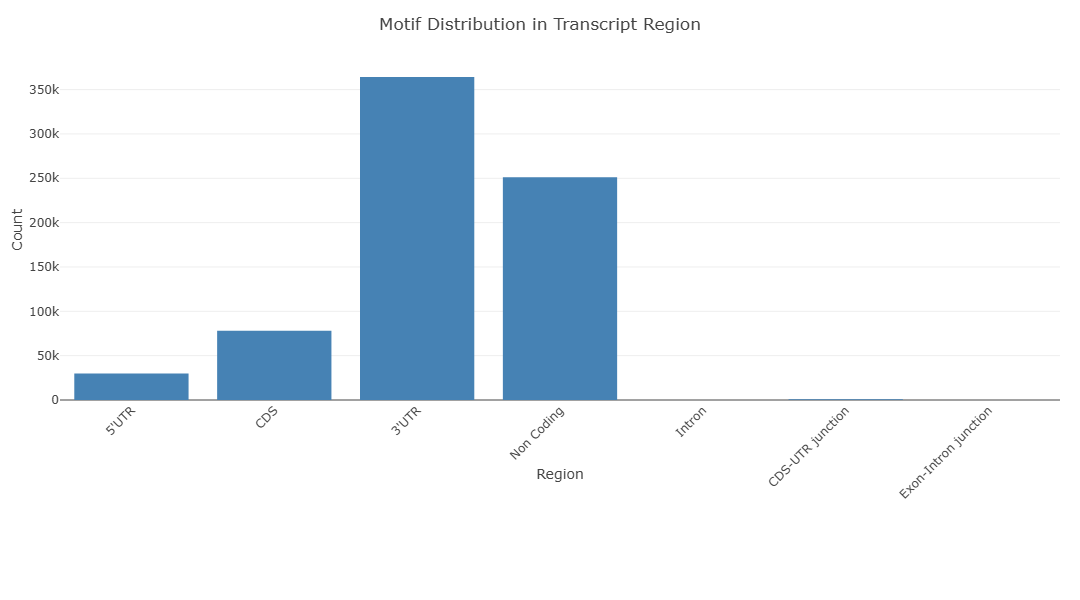
The next plot shows the motif distribution across transcript regions. Please note that the entire squence of non-coding trancripts from a coding gene is classified as "Non Coding" despite it may share identical regions to UTRs from its coding counter parts. However since the "coding region" is technically undefined for these transcripts, it is not possible to distinguish UTR from the rest of the transcript.
Finally, all motif instances are shown as a table where it is possible to filter each column to facilitate browsing. In addition, we also provide links to relevant pages for detailed information on motifs, UCSC motif track hubs, and gene or transcript motif pages
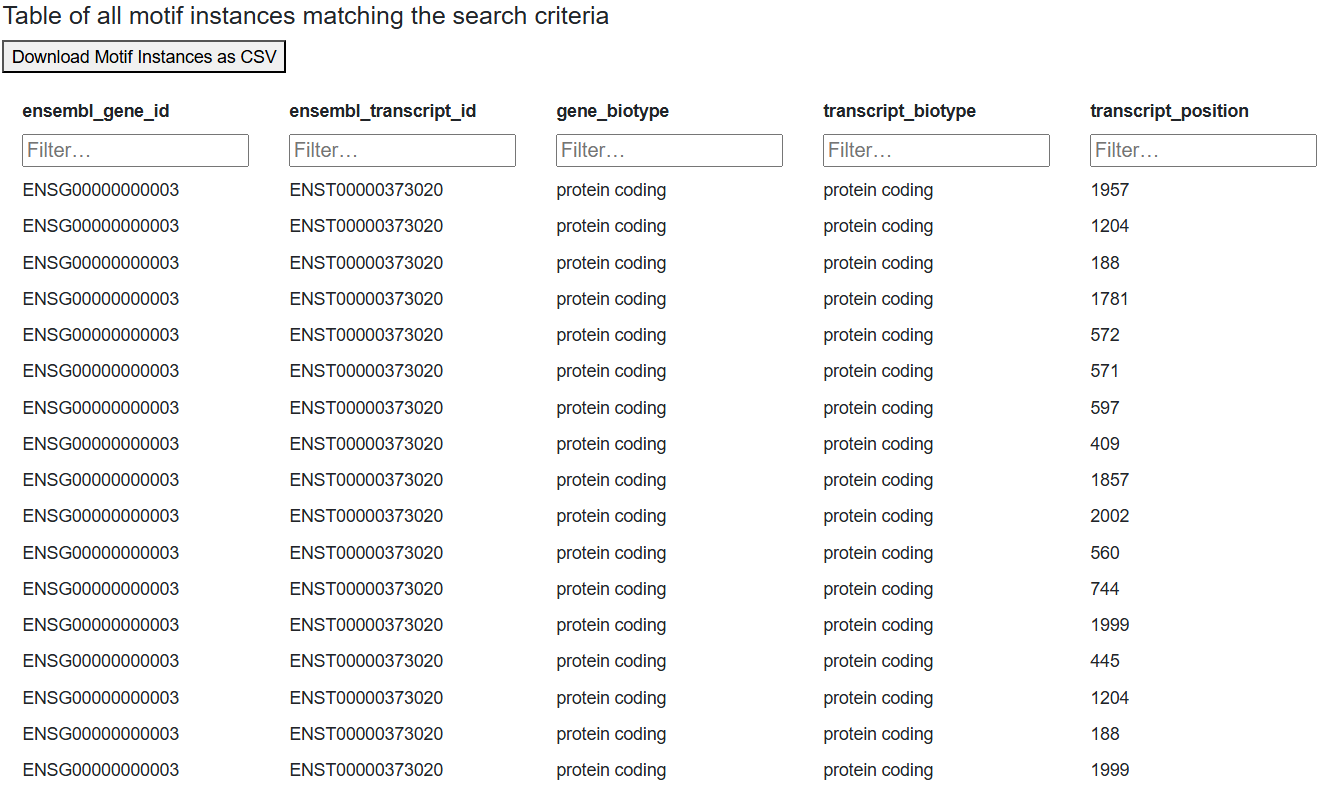
Please notice that not all combinations of search criteria will produce results. For example, choosing "snoRNA" for gene and transcript types while "CDS" for transcript region is not a valid combination, as snoRNAs do not have CDS. We are actively working to handle the selection logic to eleminate non-valid combinations.
The first plot shows the motif abundance through bar plot, histogram, tree map and searchable table. Different motifs of the same RBP are displayed individually.
Due to potential high row count of the motif instances, we do not offer browserable view of the table. A downloadable csv is still offered, with the total number of rows to help verifying the completeness of file.

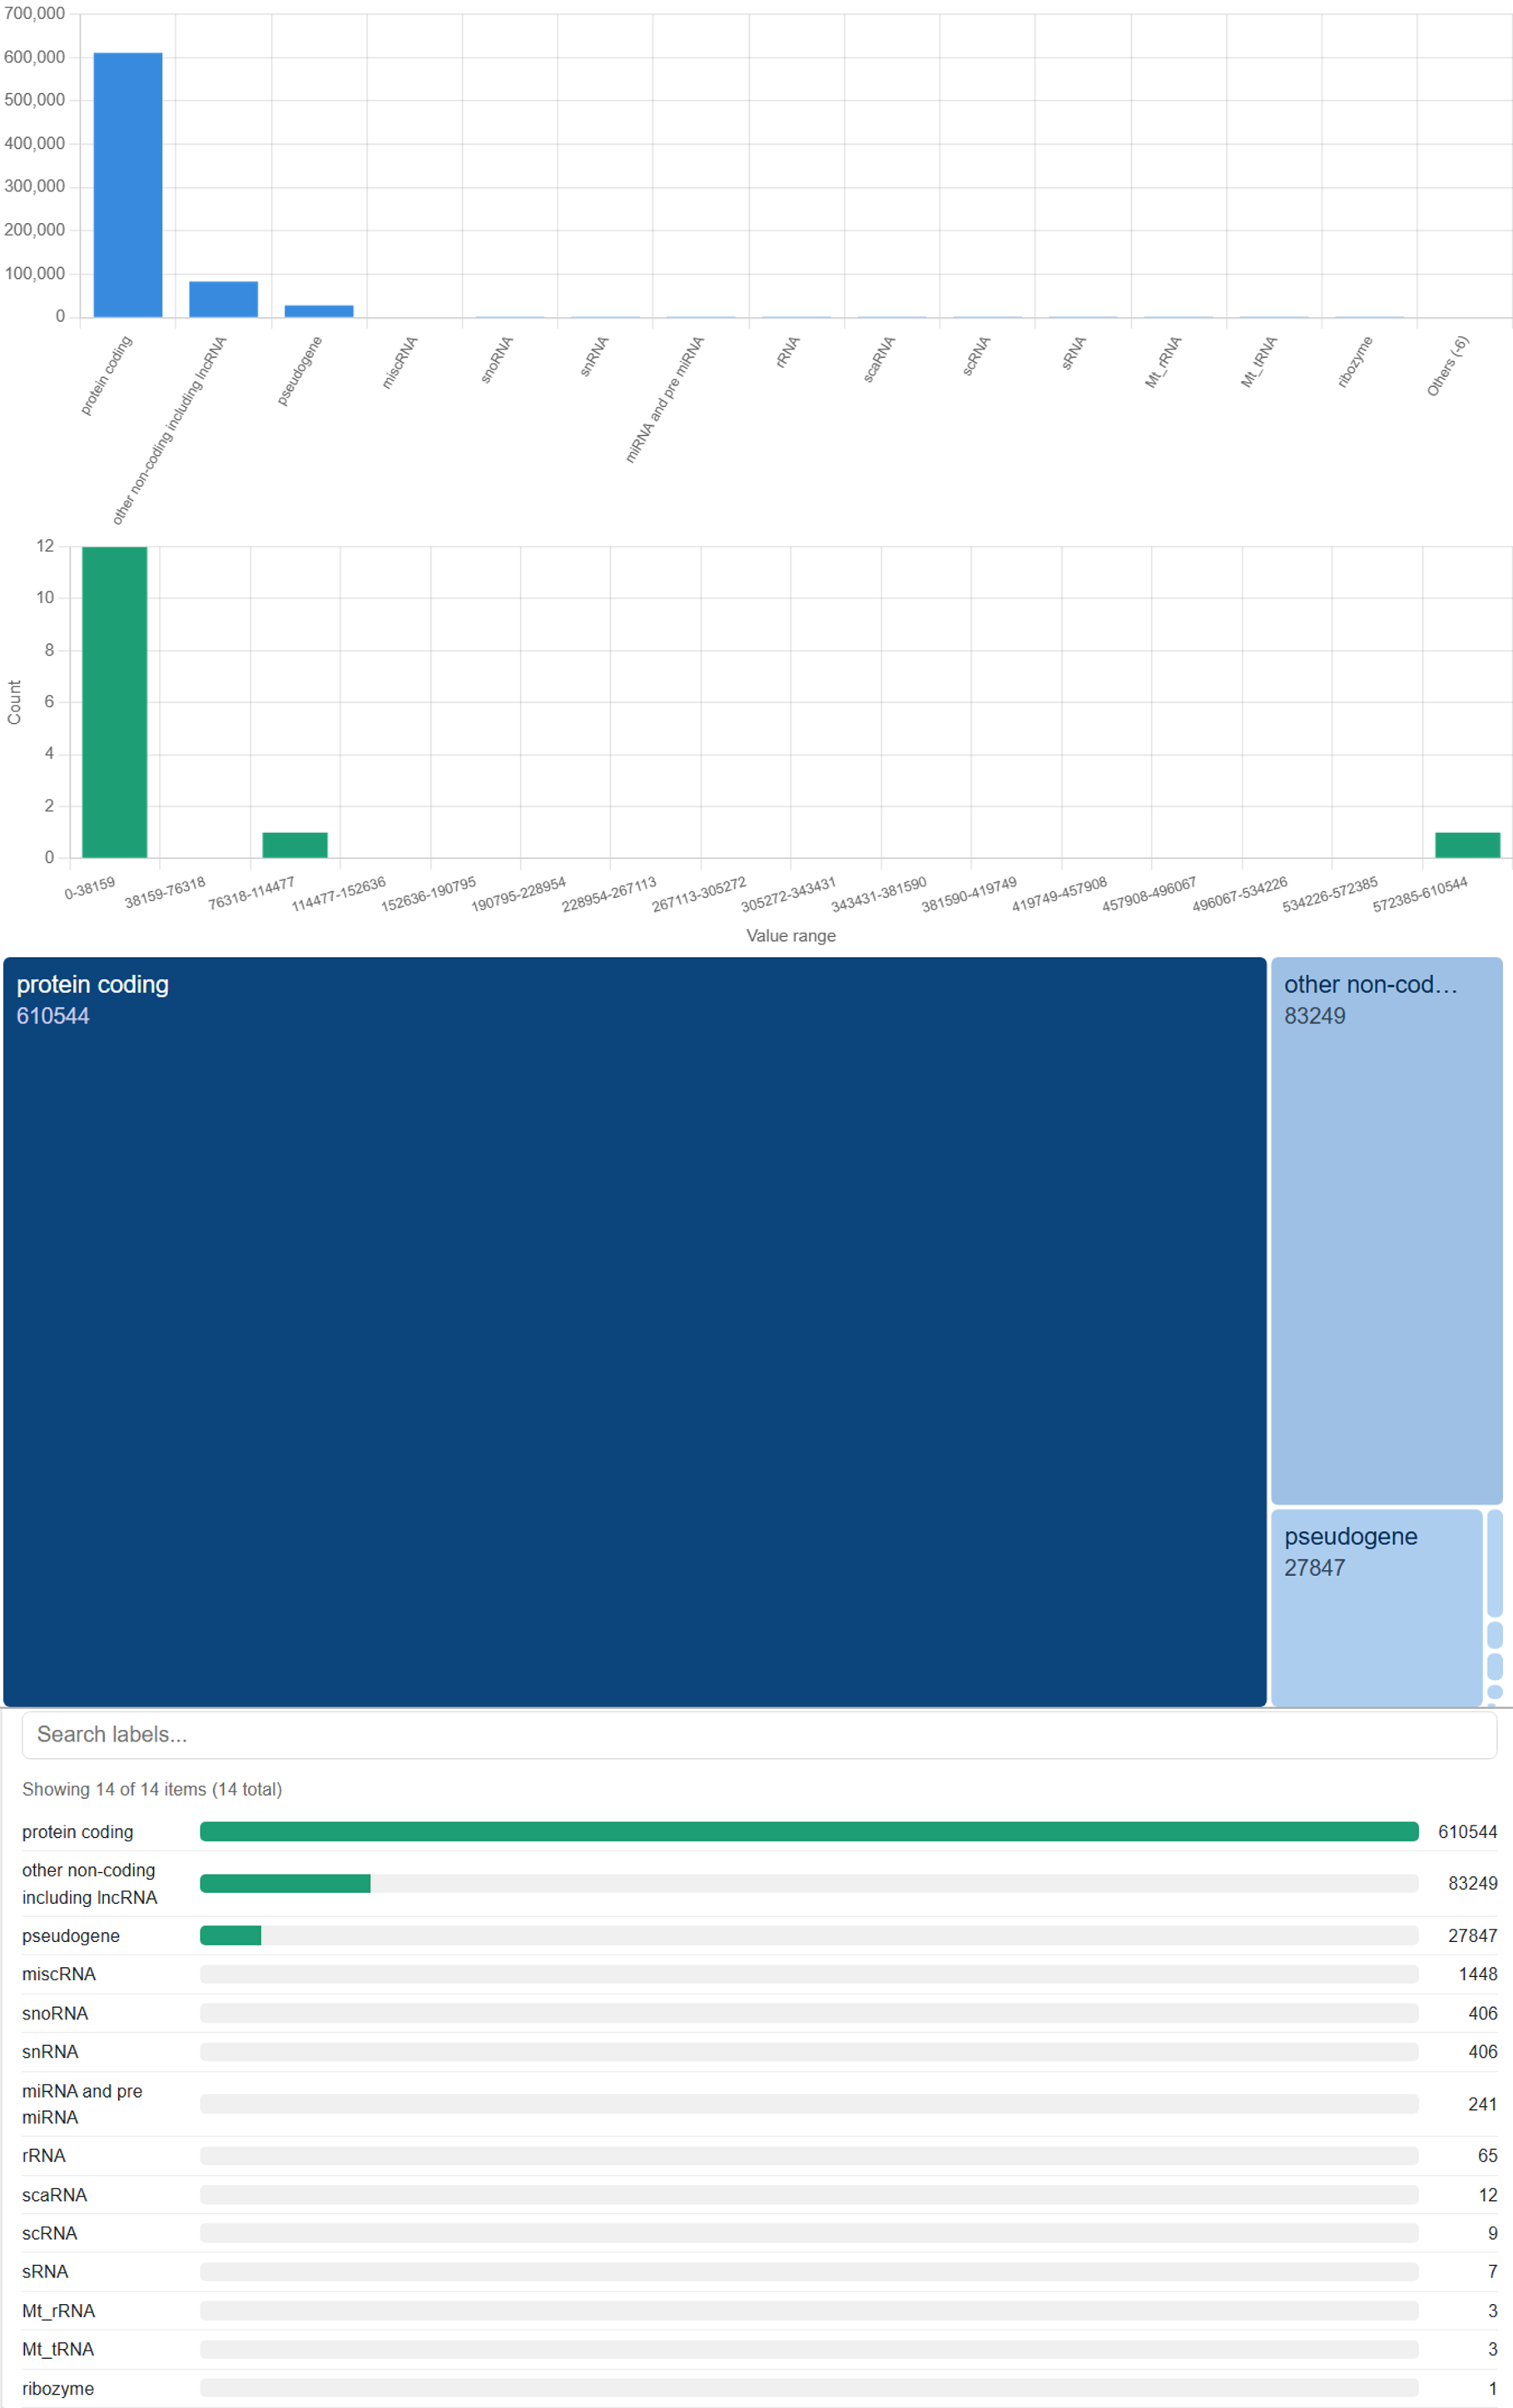
The first plot shows the biotypes of gene harboring the motif(s) of the RBP through bar plot, histogram, tree map and searchable table.
The next plot shows the motif distribution across transcript regions. Please note that the entire squence of non-coding trancripts from a coding gene is classified as "Non Coding" despite it may share identical regions to UTRs from its coding counter parts. However since the "coding region" is technically undefined for these transcripts, it is not possible to distinguish UTR from the rest of the transcript.
Due to potential high row count of the motif instances, we do not offer browserable view of the table. A downloadable csv is still offered, with the total number of rows to help verifying the completion of file.

After the call back, all motifs from the same cluster (see above) are displayed with a marker shape assigned to each of them.
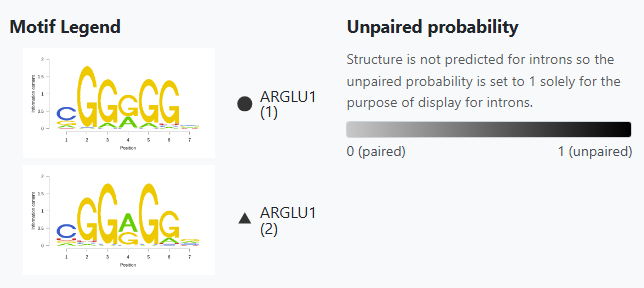
This is followed by the plots for transcripts and introns from the given gene or transcript. If a transcript or an intron does not contain any motifs from the motif cluster, the transcript or intron is omitted from this page.
On the left, the motifs are plotted with the transcript position as x-axis, and the motif score as y-axis, with the shade indicating its unpaired probability. On the right, we show the structure predicted by RNAfold and visualized by FornaContainer.
We decided to not predict structure for the intronic sequences, as it is unlikely to reflect the true structure of the intron in its context. In this case the unpaired probability is set to 1 solely for the purpose of display for introns.
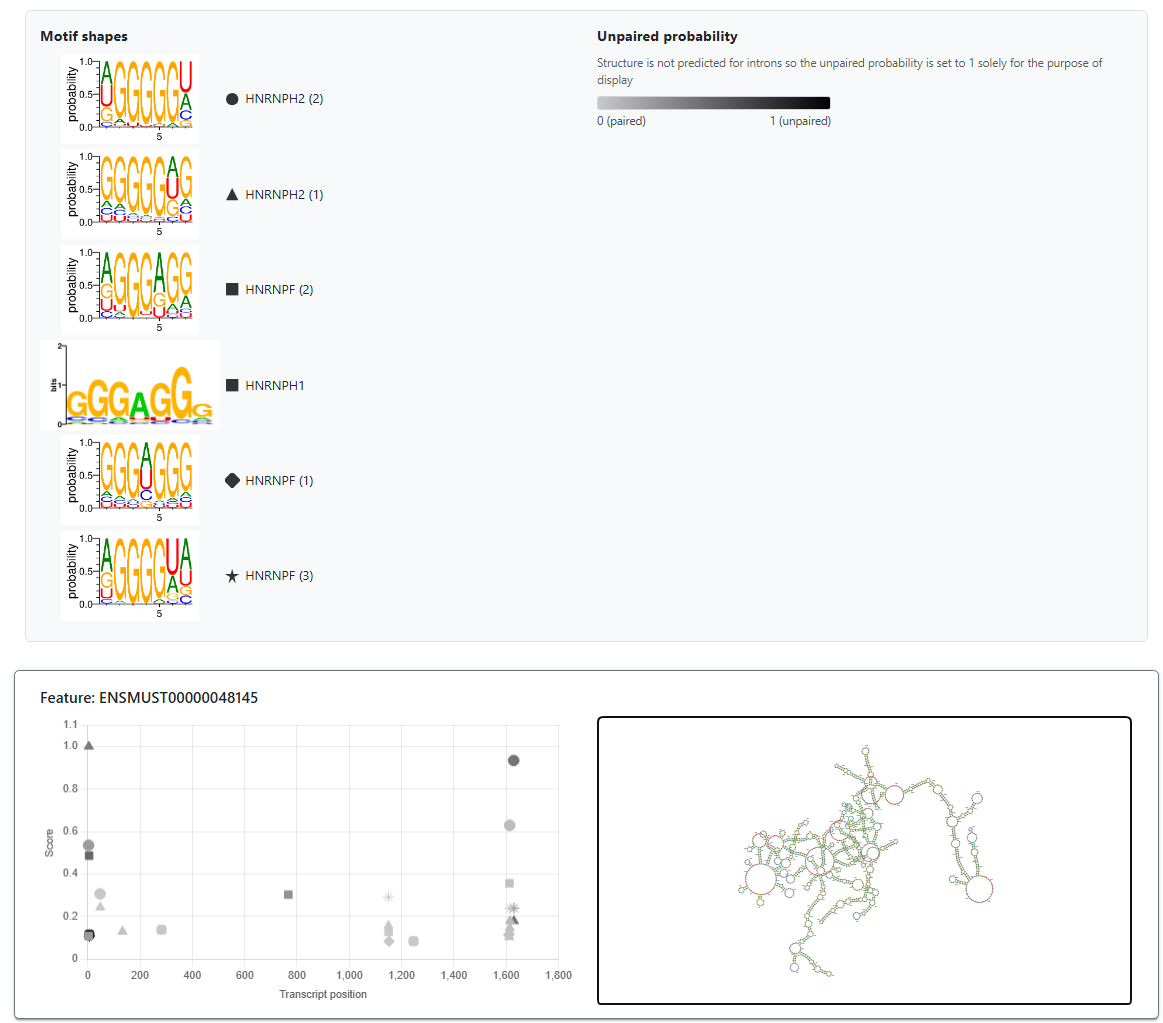
In the rendered result pages, the introns are explicitely stated by their host transcripts IDs, with intron numbers and side information.
In the raw tables, we use feature ID instead, to reduce storage space. The feature ID of an intron is derived from its host transcript, in the format of (transcript id)_(intron number)_(side), where side indicates whether it involves the 5' or 3' of the intron, or 5-3 if the entire intron is shorter than 300 nt. We do not include predicted structure for introns as the predictions based on 150 nt region are unlikely to reflect the true structure of introns within their context.
UCSC Genome Browser Track Hub
Overview
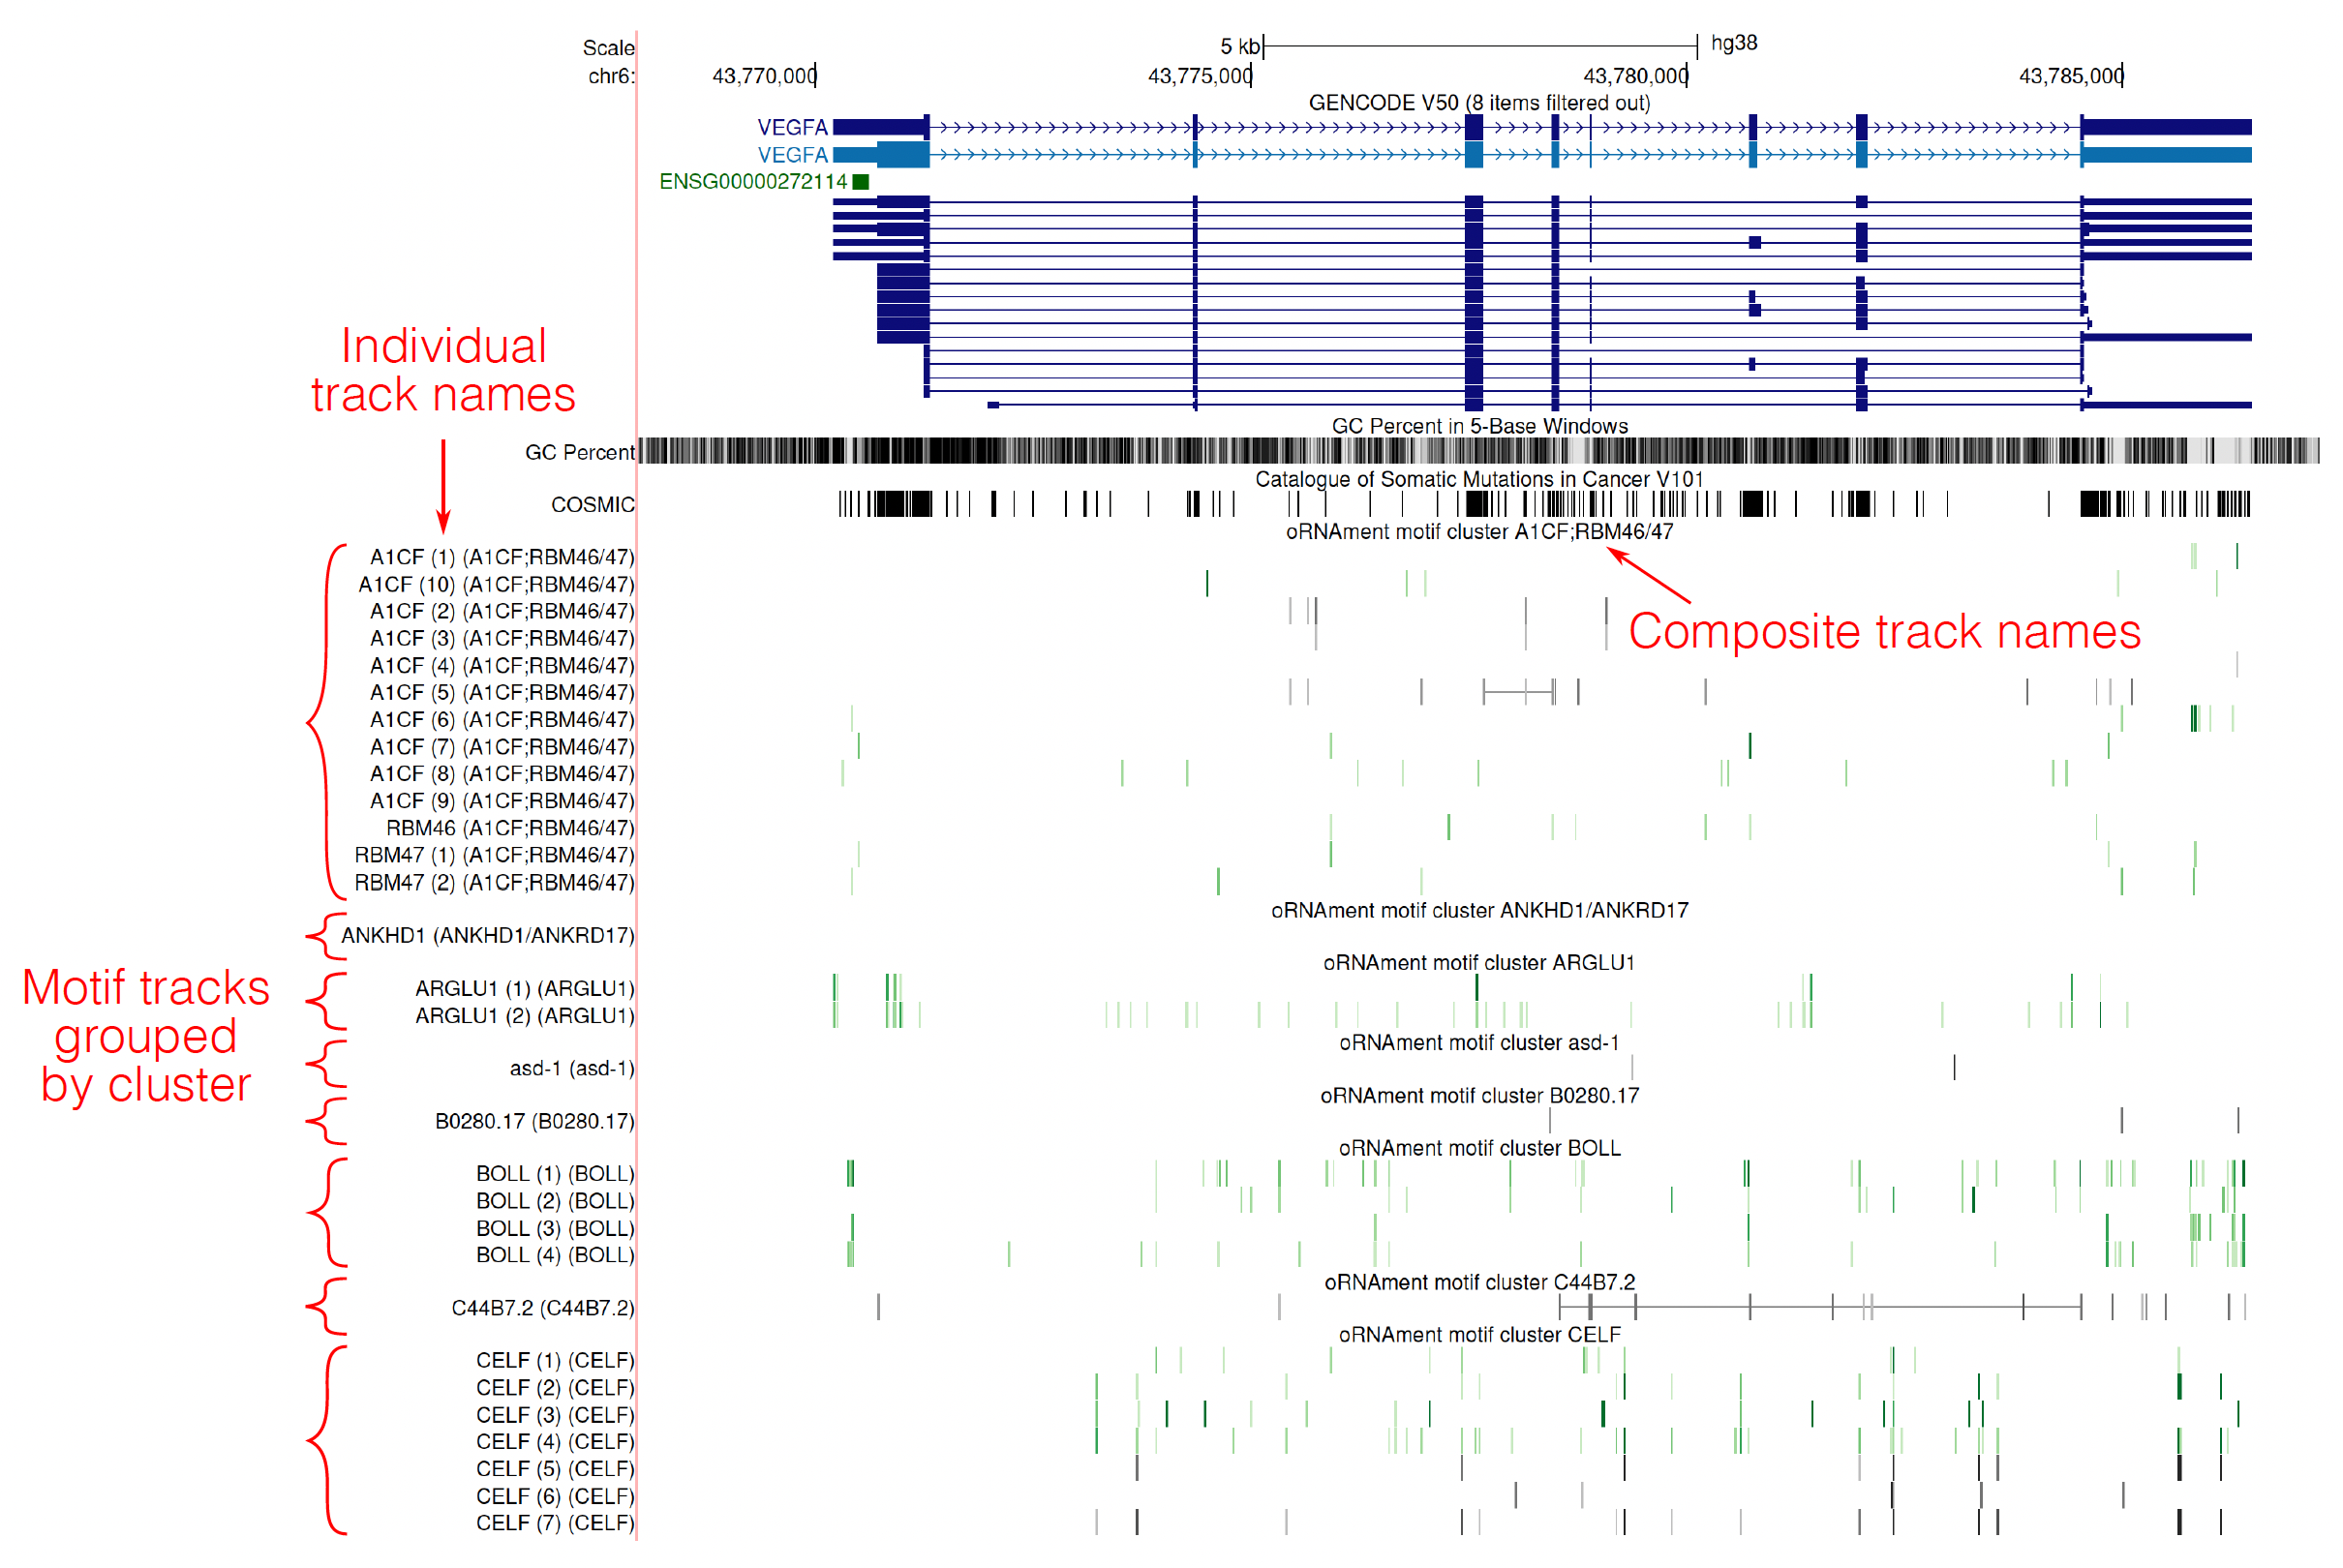
To enable transcriptome-wide visualization of oRNAment’s RBP target sites, we created UCSC Genome Browser Track Hubs (Casper et al., NAR, 2026; Raney et al., Bioinformatics, 2014). Each species has its own super track containing 175 composite tracks, each of which corresponds to a motif cluster (for mor information on motif clusters, please refer to Supplemental Table S1 of the oRNAment V2 manuscript). In turn, each composite track contains one track per motif from within the corresponding cluster. The hierarchical structure of the super track renders the visualization of oRNAment V2’s putative RBP binding sites highly flexible and customizable: users can selectively view specific motif clusters of interest and can also filter each cluster to only view specific motifs of interest, with all other tracks hidden. Please refer to the UCSC Genome Browser website for more detailed information regarding super and composite tracks.
To improve visualization of putative RBP binding sites, we applied two distinct color schemes: sites associated with species-matching motifs are shown in green, whereas all other sites are shown in gray. In both cases, color intensity reflects the percentile bin of each putative RBP binding site score. Lighter shades indicate lower percentiles and weaker scores, while darker shades indicate higher percentiles and stronger matches to the canonical motif. Each gradient is divided into five percentile bins: 50-60 (lightest), 60-70, 70-80, 80-90, and 90-100 (darkest).
Track hub links
The oRNAment V2 webpage’s Table View provides a hyperlink for every putative RBP binding site, which will redirect the user to the UCSC genome browser where they can visualize the data for that particular binding site. Users who wish to access the track hubs generally can use the following URLs:
Customizing the genome browser view
The track hubs for all species are available as hyperlinks on oRNAment’s website. To open the track hub in the UCSC Genome Browser, simply click on the link. Please note that it is normal for the track hub to take a few minutes to load, particularly for human and species with larger genomes.
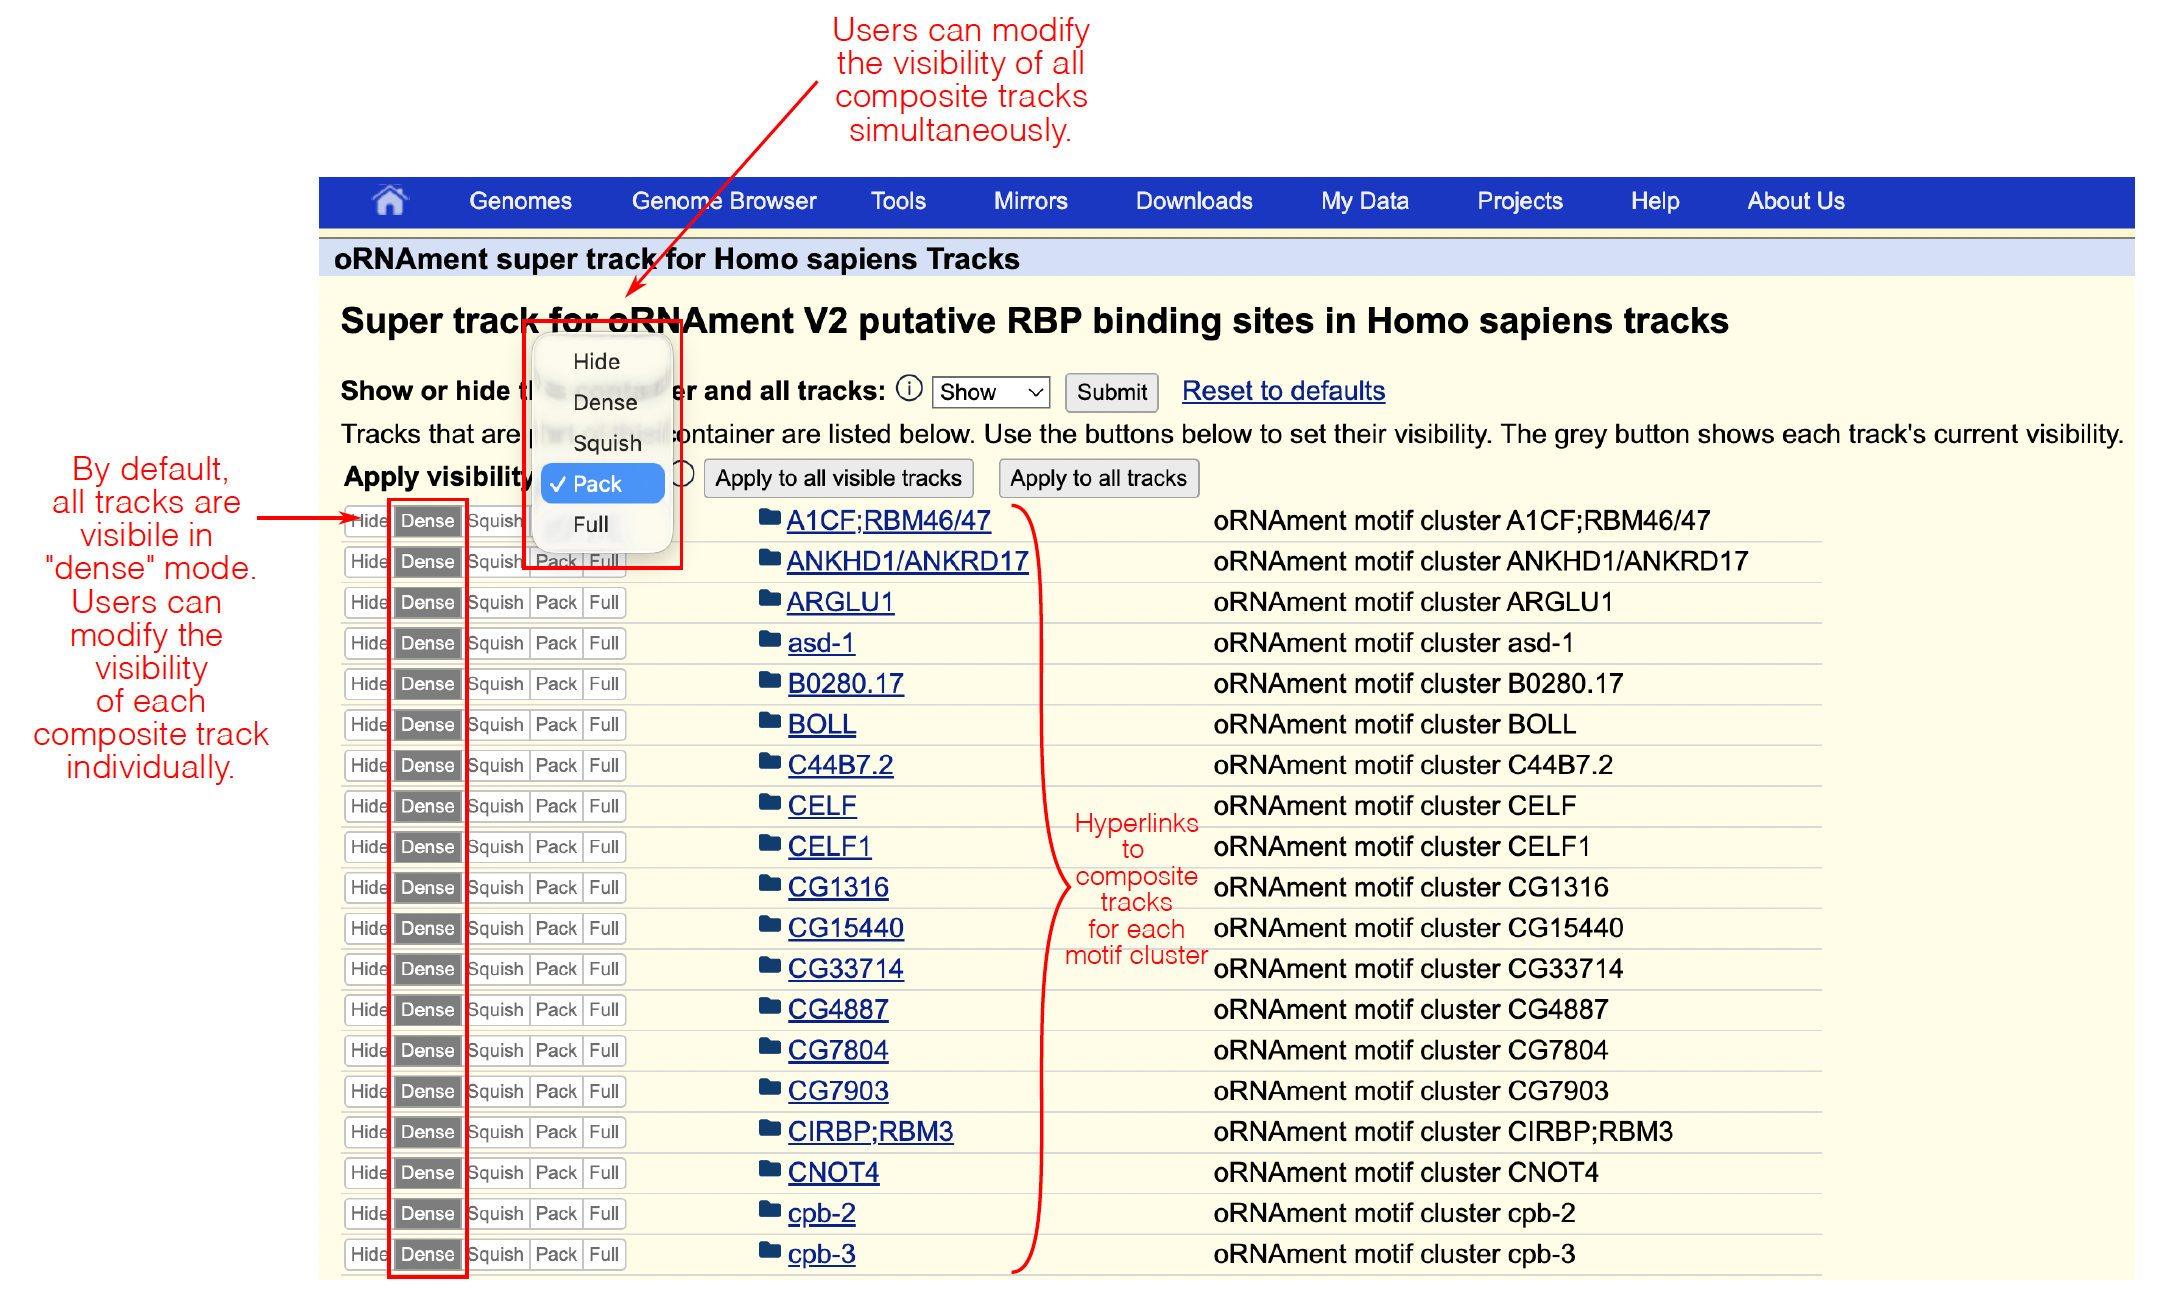
By default, all tracks will be visible in “dense” mode upon loading of the track hub. Composite tracks are each labeled with the header “oRNAment motif cluster <cluster name>”. Individual tracks for each motif are labeled on the left-hand with a short label in the form “<motif name (cluster name)>”.
To customize the track hub, users should scroll down to the bottom of the page, and click on the hyperlink that reads “oRNAment super track for <species name>. Note that, below the oRNAment super track, there are also public track hubs available, which users can view alongside the oRNAment tracks by setting visibility from “Hide” to “Show.”
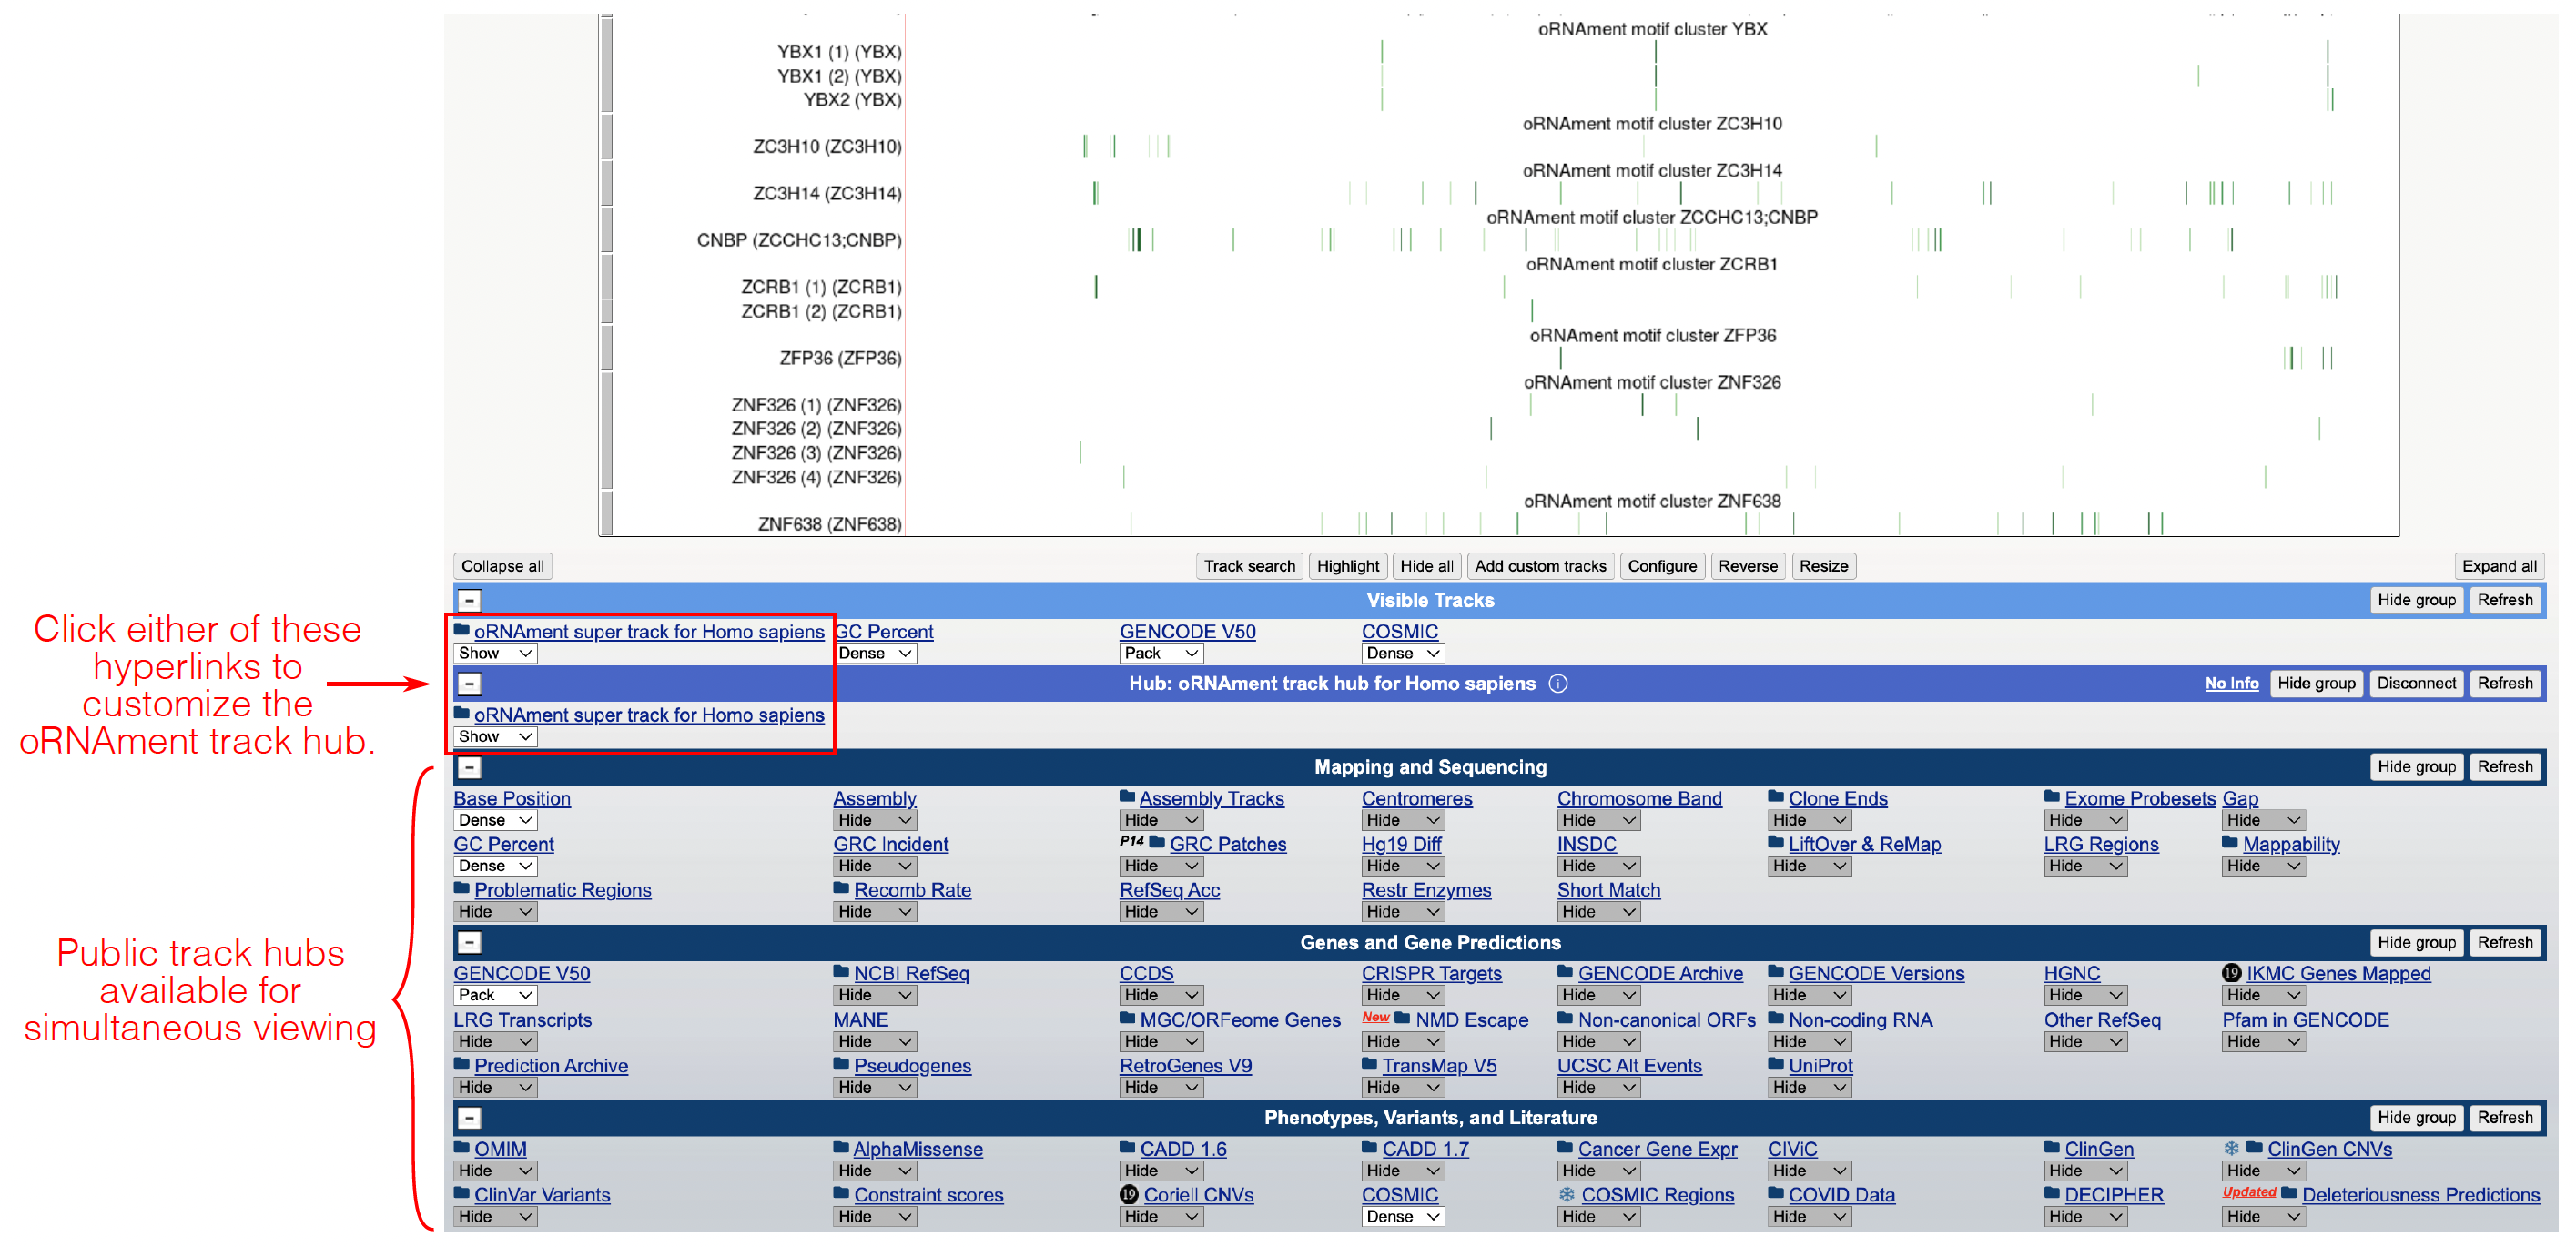
The oRNAment track hub hyperlink will redirect to a page containing a list of 175 composite tracks, with one composite track per motif cluster. Users can show, hide, or change the visibility settings of all composite tracks at once or only specific composite tracks of their choosing.
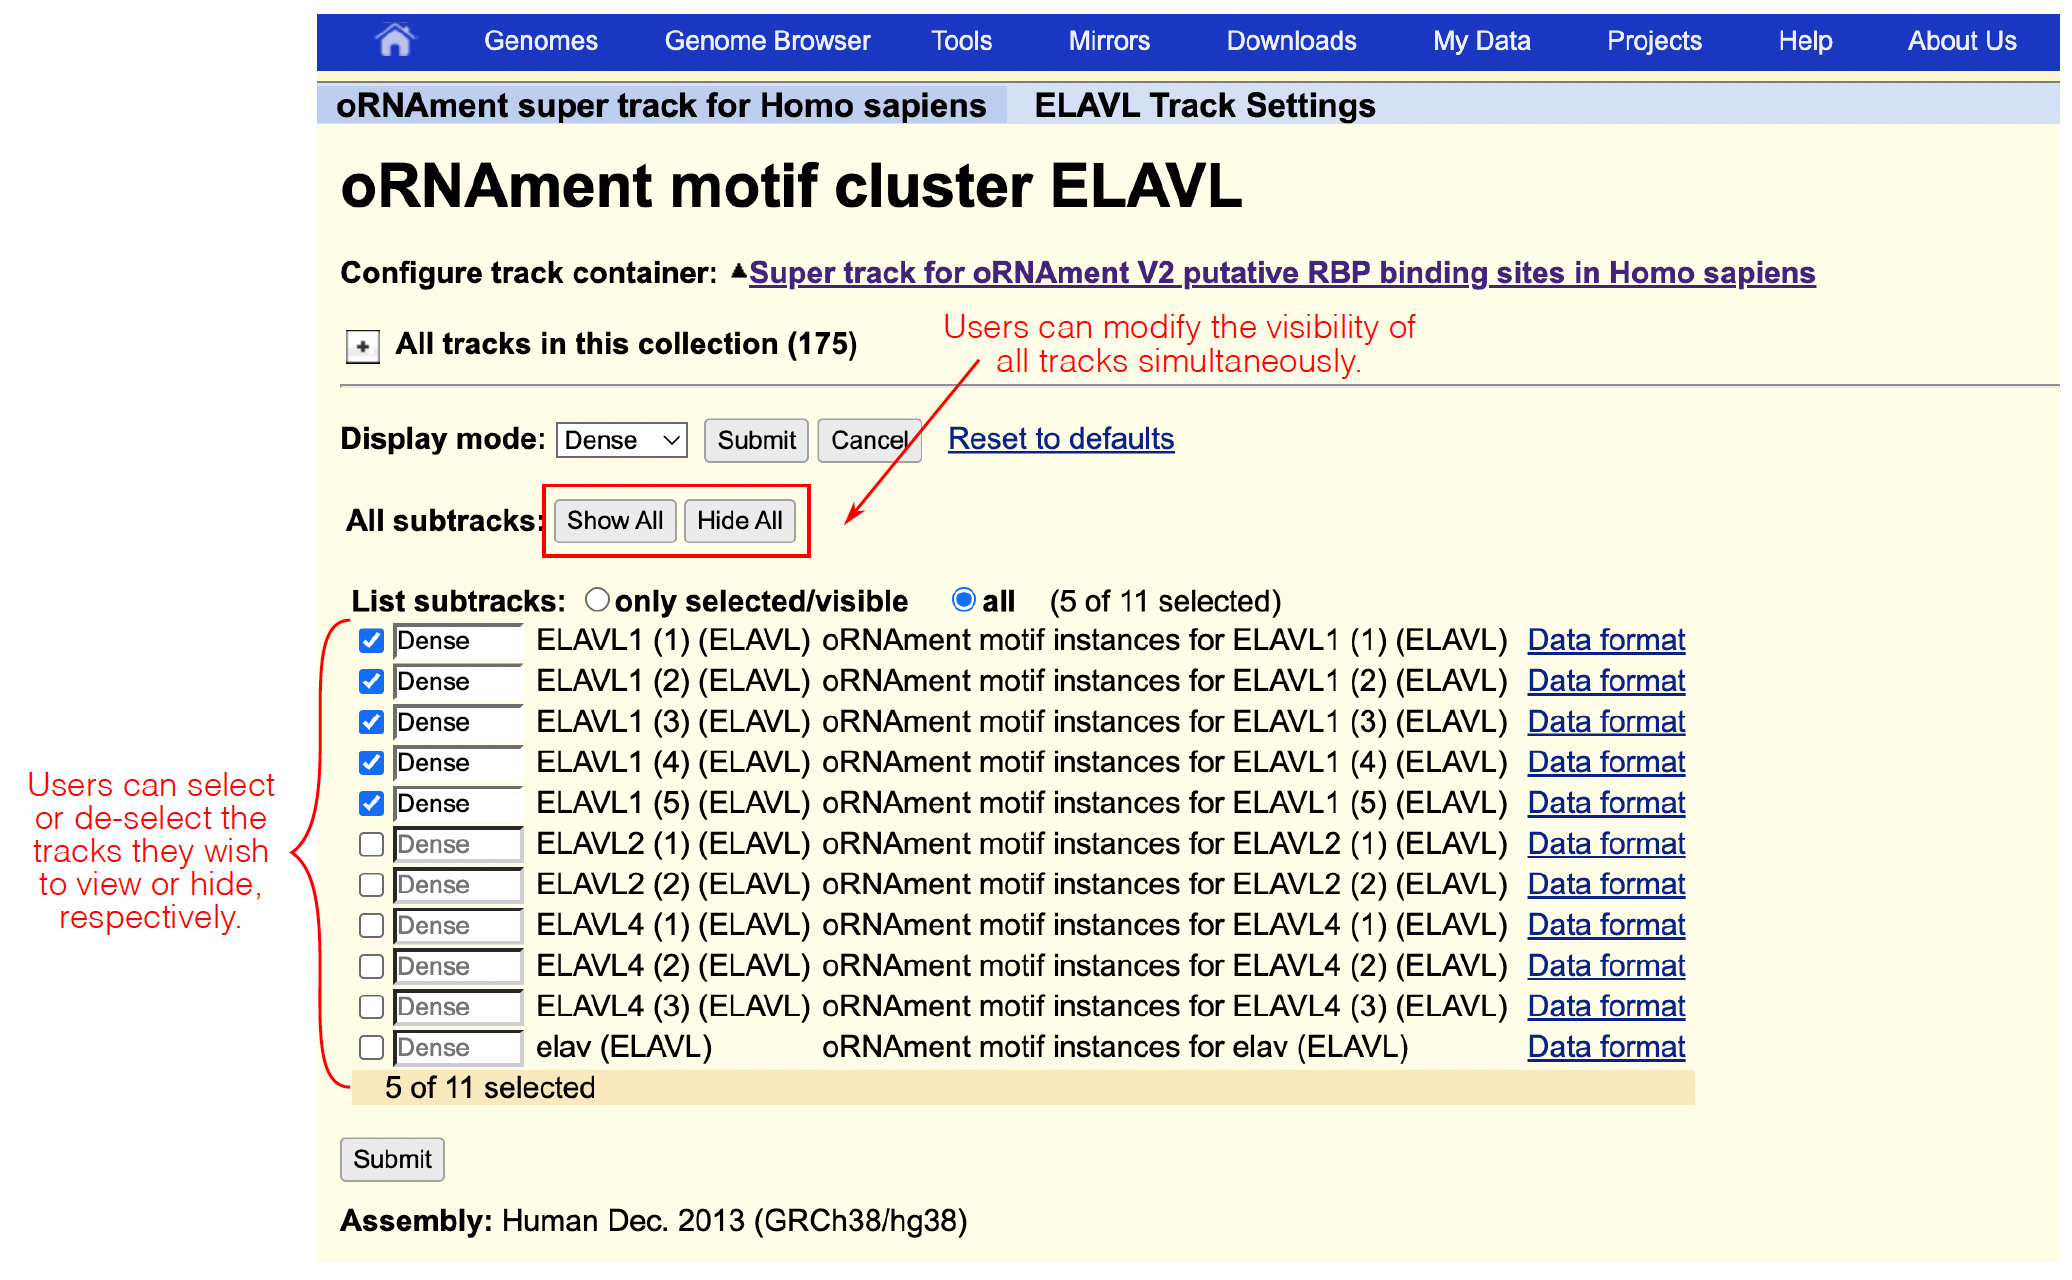
Users can also customize which tracks within each motif cluster are displayed. Clicking on an individual composite track will redirect the user to a new page, this time containing a list of all motif tracks within that particular cluster. Similarly to at the composite track level, users can show, hide, or change the visibility settings of all motif tracks at once, or only for specific motif tracks of their choosing. CLIPdb tracks are also present for viewing, if data is available for a particular RBP in a given species.
Example use case
Below is an example use case demonstrating how users can customize oRNAment tracks to visualize a locus of biological interest. Displayed is the VEGFA gene in human, which is critical for angiogenesis and whose upregulation is a hallmark of cancer (Hanahan, Cell, 2026). VEGFA undergoes extensive post-transcriptional regulation, particularly via binding of RBPs (such as those displayed on the left-hand side, and others) in AU-rich elements of the 3’UTR to control mRNA stability (Arcondéguy et al., NAR, 2013). The GENCODE annotation displaying VEGFA isoforms is displayed at the top. Below, the oRNAment super track consists of a composite track for each motif cluster, where each composite track itself is composed of individual tracks for each constituent motif. For example, oRNAment motif cluster HNRNPL contains 4 motifs and oRNAment motif cluster ZFP36 contains 1 motif. Users can easily customize the track hub by (1) displaying only the motif clusters of interest (in this example, only 7 of 175 motif clusters are displayed) and (2) displaying only the motifs of interest within each cluster (in this example, only ELAVL1 motifs but not ELAVL2, ELAVL4, or elav motifs from the ELAVL cluster are displayed; only PTBP1 motifs but not PTBP2 or PTBP3 motifs from the PTBP cluster are displayed; etc.)
CLIPdb tracks can be viewed when data is available for a particular RBP in a given species. CLIPdb peaks located in regions scanned by oRNAment are indicated in dark purple, while CLIPdb peaks located in regions not scanned by oRNAment are indicated in light purple. Users can also load publicly available tracks, such as the GC content and COSMIC tracks displayed here, to view alongside the oRNAment track hub for easy integrative visualization.
Finally, for putative RBP binding site tracks, the green color intensity reflects the percentile bin of the putative binding site’s score, as previously described above. Users can also view the score percentile by expanding the track, either by clicking on the track itself or by setting the visibility mode to “pack”, as exemplified below for the putative ELAVL1 binding sites.