RBP Image Database
The science behind the RBP Image Database
The RBP image database is a comprehensive database housing systematic microscopy imaging data and manually curated pattern annotations describing the subcellular distribution features of human RNA binding proteins (RBPs). The current database version has a comprehensive collection of ~265,000 images and annotations for 301 RBPs in relation to 12 markers for cellular organelles and substructures, obtained through systematic immune-fluorescence imaging in human HepG2 and HeLa cell lines. Each RBP entry in the database contains detailed information on Ensembl Gene IDs, cell type, quality, imaging parameters, and localization information.
The core data organized in this database was generated in the context of a systematic study of human RNA binding proteins (Van Nostrand et al. 2020 Nature) These studies utilized a collection of commercial RBP antibodies that were thoroughly validated for their specificity via immunoprecipitation, Western blotting, and loss-of-expression methodologies.
This database was developed and is maintained by the Lecuyer Lab. Please email us for any comments, suggestions or bug reports.
For immune-fluorescence imaging, HepG2 & HeLa cells were seeded in 96-well clear bottom plates (Corning; plate number 3882) in DMEM + 10% FBS. After 72 h in standard growth conditions (37 °C and 5% CO2), cells were fixed with 3.7% formaldehyde, permeabilized in PBS + 0.5% Triton X-100 and blocked in PBS + 0.2% Tween-20 + 2% BSA (PBTB), all performed for 20 min in room temperature.
Primary antibodies (host: rabbit) for the RBPs of interest and marker proteins were subsequently applied to the cells (2 μg/ml in PBTB) and incubated overnight at 4 °C. The cells were next washed three times for 10 min each in PBST and incubated with secondary antibodies (Alexa647 donkey anti-rabbit and Alexa488 donkey anti-mouse, both diluted 1:500 in PBTB) for 90 min at room temperature. Following three PBTB washes, the cells were counterstained with DAPI for 5 min, washed three times in PBS, and kept in PBS at 4 °C.
The host species, names, catalog number, dilutions, and manufacturers information of subcellular marker antibodies were as follows:
| Host species | Marker | Catalog number | Manufacturer | Dilution ratio | Comments |
|---|---|---|---|---|---|
| rat | Anti-α-tubulin | MCA78G | Serotec, Bio-Rad | 1:200 | |
| mouse | Anti-CD63, | ab8219 | Abcam | 1:200 | |
| mouse | Anti-coilin | GTX11822 | GeneTex | 1:100 | |
| mouse | Anti-DCP1a | sc100706 | Santa Cruz Biotechnology | 1:200 | |
| mouse | Anti-fibrillarin | ab4566, | Abcam | 1:200 | |
| mouse | Anti-GM130 | #610822 | Becton Dickinson | 1:200 | |
| mouse | Anti-KDEL | ENZSPA827D | Enzo Life Sciences | 1:200 | |
| mouse | Anti-phosphotyrosine | #9411S | NEB | 1:200 | |
| mouse | Anti-PML | sc-966 | Santa Cruz Biotechnology | 1:50 | |
| mouse | Anti-SC35, | GTX11826 | GeneTex | 1:200 | |
| - | Mitotracker | M22426 | Molecular Probes | - | Cells were incubated with 100 nM dye in culture medium for 45 min at 37 °C before fixation. |
| - | Phalloidin | P5282 | Sigma | - | Cells were incubated with 50 μg/ml of phalloidin for 20 min before DAPI staining. |
Imaging was performed on an ImageXpress Micro high content screening system (Molecular Devices). For each RBP–marker combination, 10–20 high-resolution images were obtained in the DAPI, FITC, and Cy5 channels, using a 40× objective with exposure times ranging from 250 to 3,000 ms, 100 to 500 ms, and 50 to 100 ms for RBP, marker, and DAPI channels, respectively, thus generating raw unprocessed greyscale images (TIF files). An in-house MATLAB script was developed for batch normalizing image intensity values and adding blue, green, or red colours to the respective channels, which were then merged as colour JPEG files. The final images were uploaded to a server and made accessible through the RBP Image Database website. A controlled relational vocabulary of descriptors was created and systematically utilized by human curators to describe the subcellular localization features of each RBP in relation to subcellular markers.
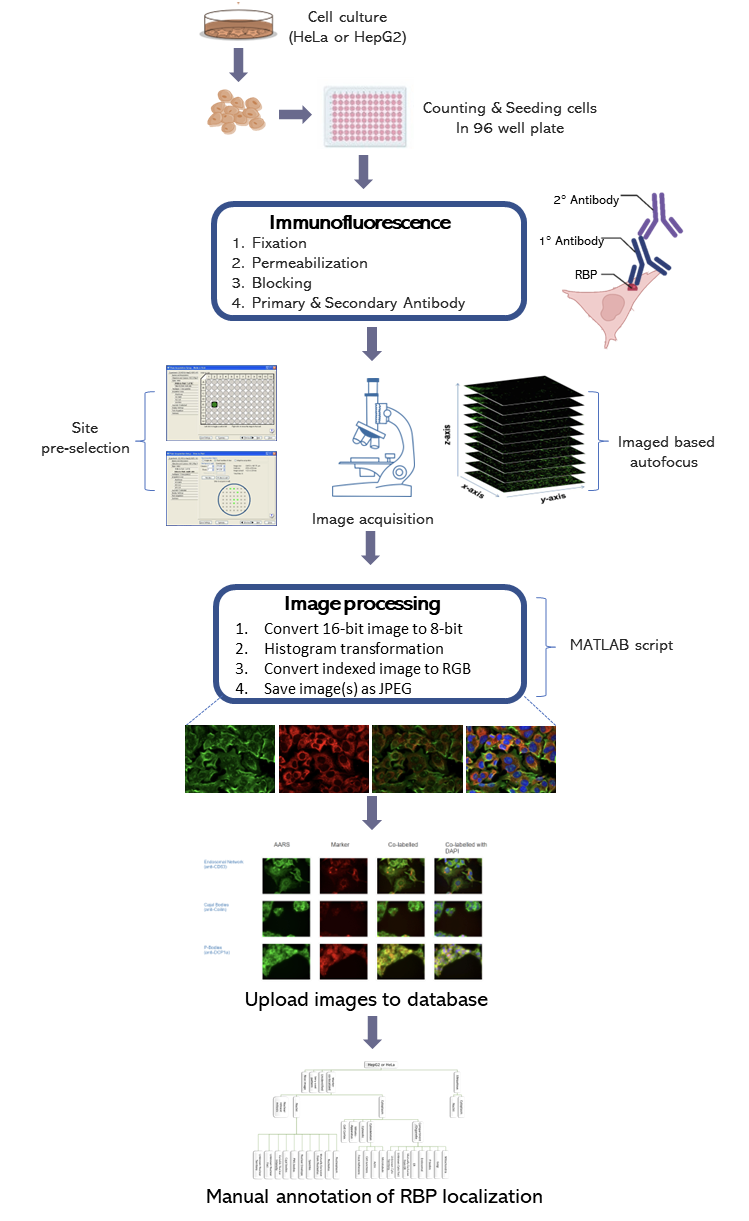
An in-house MATLAB script was developed for batch normalizing image intensity values. The script converts the single channel (DAPI, Cellular marker, or RBP) images (.tif) for each site from 16-bit to 8-bit and the colour intensity is adjusted for the channel of interest. Then the script converts the respective indexed images to an RGB image by setting the empty channels to black. The colour of the image is set as red for the cellular marker, green for the RBP, and blue for the DAPI staining. Lastly, four images are printed (red channel, green channel, merged image of the red and green channel, merged image of the red, green, and blue channel).
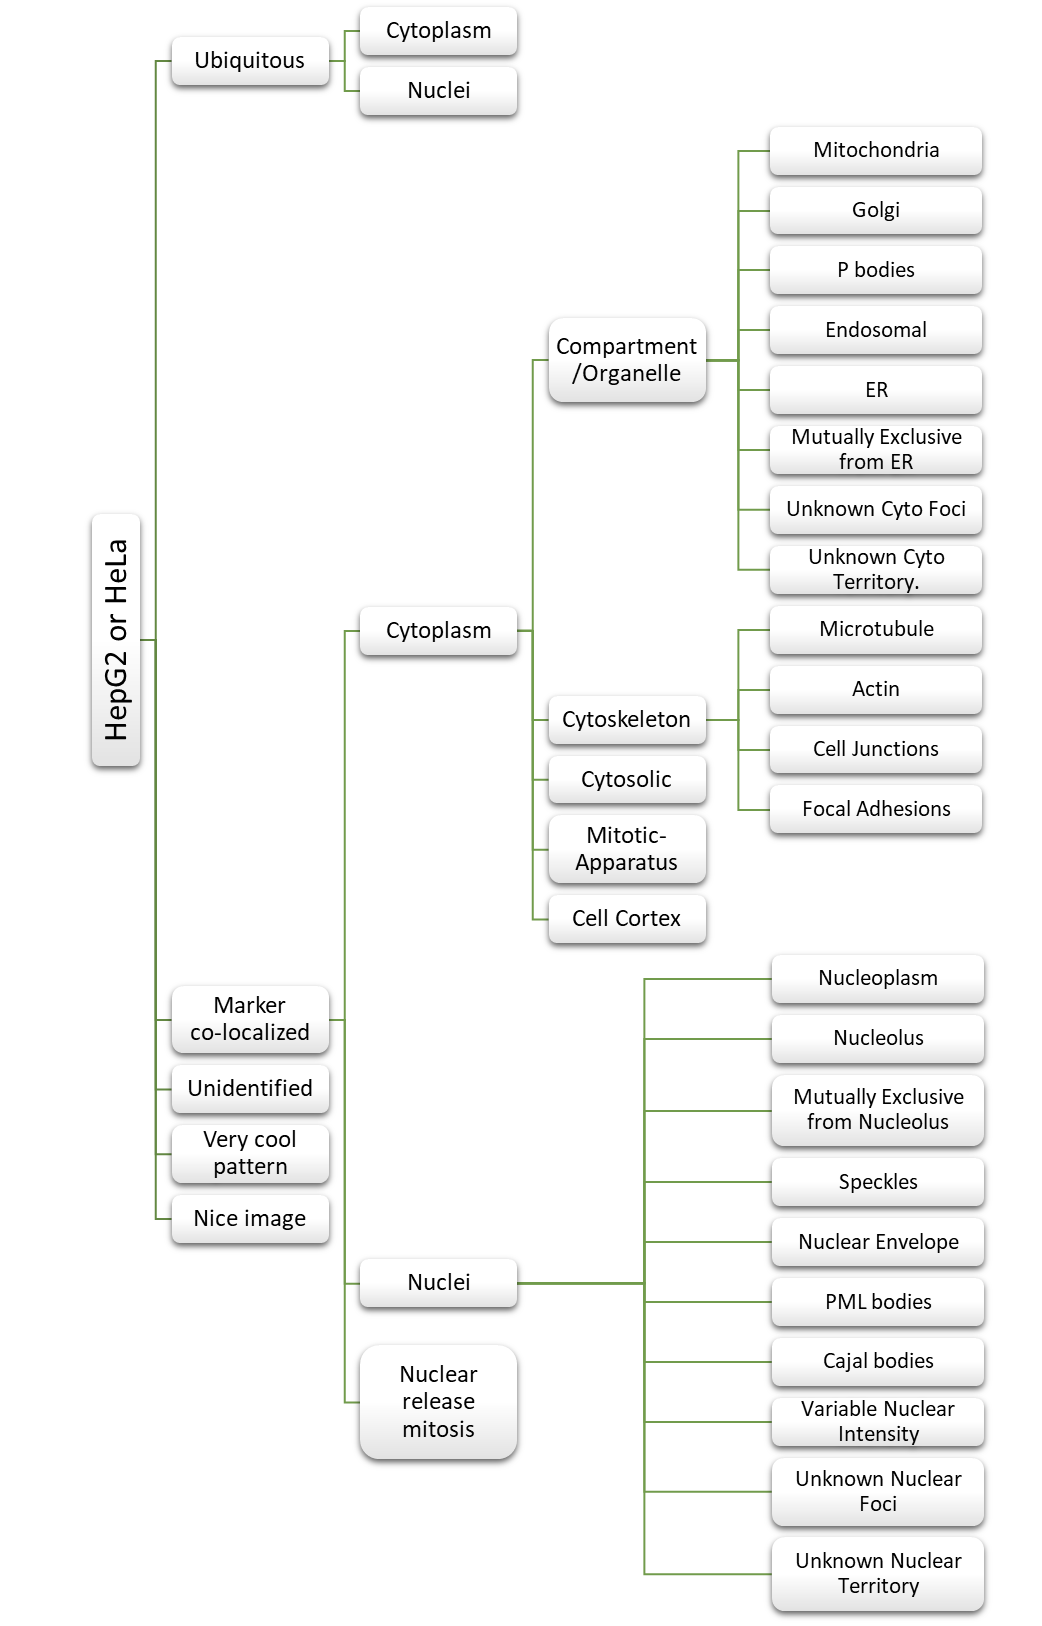
The final images were uploaded to a server and made accessible through the RBP Image Database website. A MySQL relational database was implemented to store the images, data annotations and characteristics. A controlled relational vocabulary of descriptors was created and systematically utilized by human curators to describe the subcellular localization features of each RBP in relation to subcellular markers. The annotator could switch between the different channel, the composite images during the process and select the annotation appropriately from the annotation tree.
Navigating the database
The database offers two options of searching RBP localization images by ‘gene symbols’ or by ‘annotation’ on the ‘Home’ page.
Users can search by gene symbol by selecting a cell line followed by the selection of a target RBP’s gene symbol and then click the ‘Search’ button. The query will lead users to a page that has images arranged according to the respective cellular markers for the RBP of interest. Clicking on an image will result in an enlargement of the respective image. The annotation can be viewed on the right-hand side of the page and provides a detailed description of the dataset.
Users can search by annotation of the RBPs by selecting a cell line followed by the selection of ‘All labels’ or ‘Any labels’ and then select any one or more annotations. After clicking the ‘Search’ button the users will find their results that have images arranged according to the RBPs associated with the label(s) for the respective cell line of choice. Clicking on an image will result in an enlargement of the respective image.
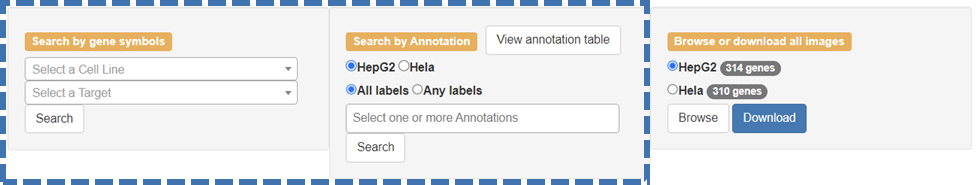
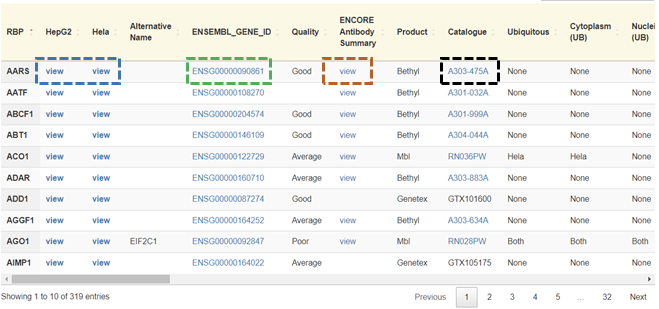
Users can display the presence or absence of localization for a given RBP in a given cell (HepG2, HeLa, Both, and None) in a tabular format by clicking on the ‘View annotation table’ button on the home page.
Users can access the images of an RBP of interest for a given cell line by clicking the ‘view’ button in the column after the gene symbol in the annotation table. Users can view the Ensembl genome database by clicking on the respective Ensembl gene ID corresponding to the RBP of interest. It is also possible to display the catalog of the specific antibody for the RBP of interest by clicking on the respective catalog number of the antibody corresponding to the RBP of interest. Users can access the respective RBPs antibody validation data by clicking on ‘view’ under the ENCORE antibody summary column. It is important to note that the Ensembl, catalog, and validation data are external Links.
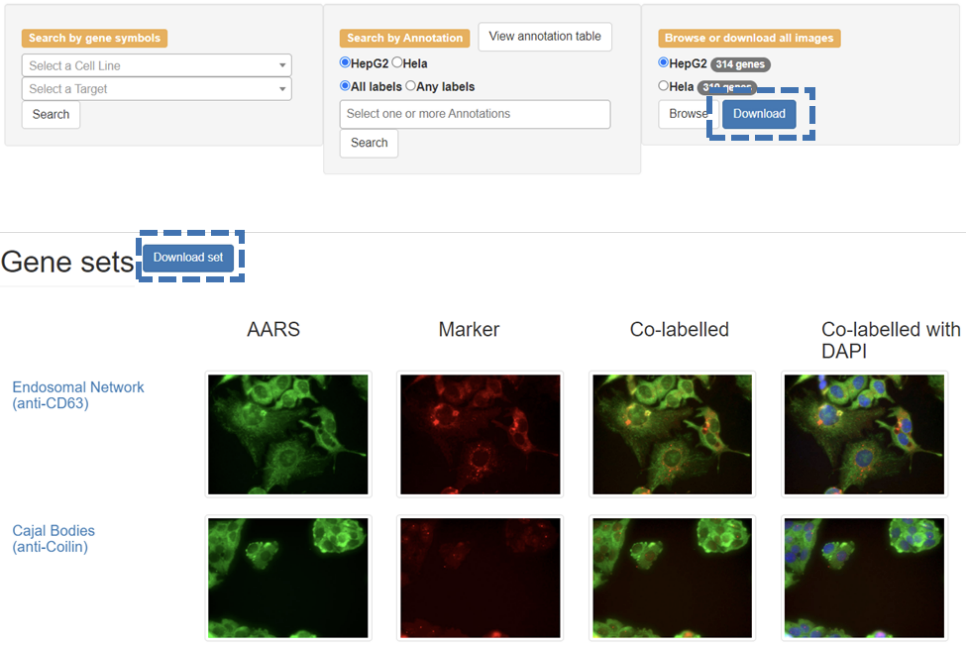
Users can download datasets from the home page by first selecting the specific cell type and then clicking the ‘Download’ button. The images will be downloaded as a gzip tarball (.tar.gz). Users can also download a set of image files for a specific RBP by searching or browsing for the RBP by gene symbol and then clicking on the ‘Download set’ button on the results page.
The database is organized according to the gene symbol of each RBP. Users can browse datasets by first selecting the specific cell type and then clicking the ‘Browse’ button on the 'Home' page and then clicking the specific gene symbol or the images of the corresponding cellular marker in the navigation menu on the 'Browse' page. Clicking on the gene symbol of the RBP will open a page that has images arranged according to the respective cellular markers. Clicking on an image will result in an enlargement of the respective image.
RBPs were imaged at five or more sites for each of the twelve co-labeled markers, and only the representative images are shown on this page. To view more images of a given marker, users can click on the name of the respective marker, which brings the user to a subpage with additional representative images, as seen in the example below.
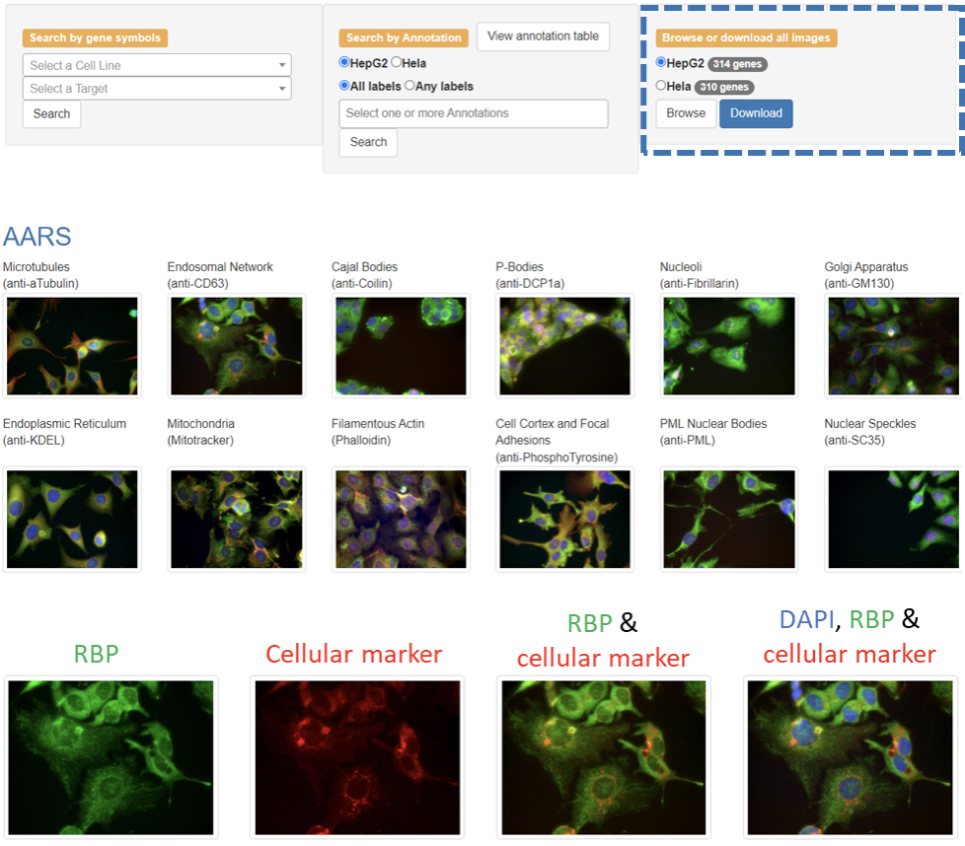
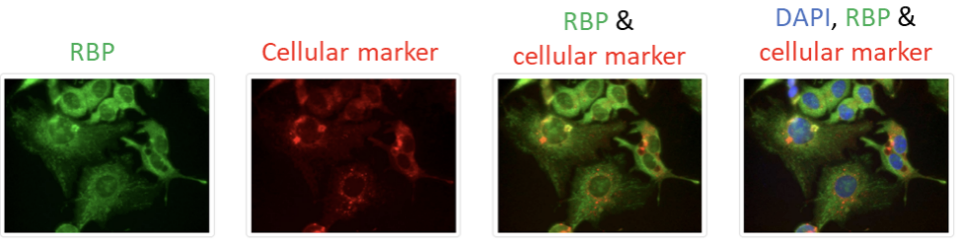
The database allows the users to view the multichannel images as well as individual channels. This is because multichannel images provide excellent information regarding colocalization but may mask some information, so it may be helpful for the users to view them individually.
For each cellular marker, the first image from the left represents the localization pattern of the RBP (green channel). The second image from the left represents the distribution pattern of the investigated markers (red channel). The third image from the left represents the composite image of the green (RBP) and red (marker) channels. The fourth image from the left represents the composite image of the green (RBP), red (marker), and blue (DAPI staining) channels. The composite images provide substantial information regarding colocalization.